Open Access
Fig. 22
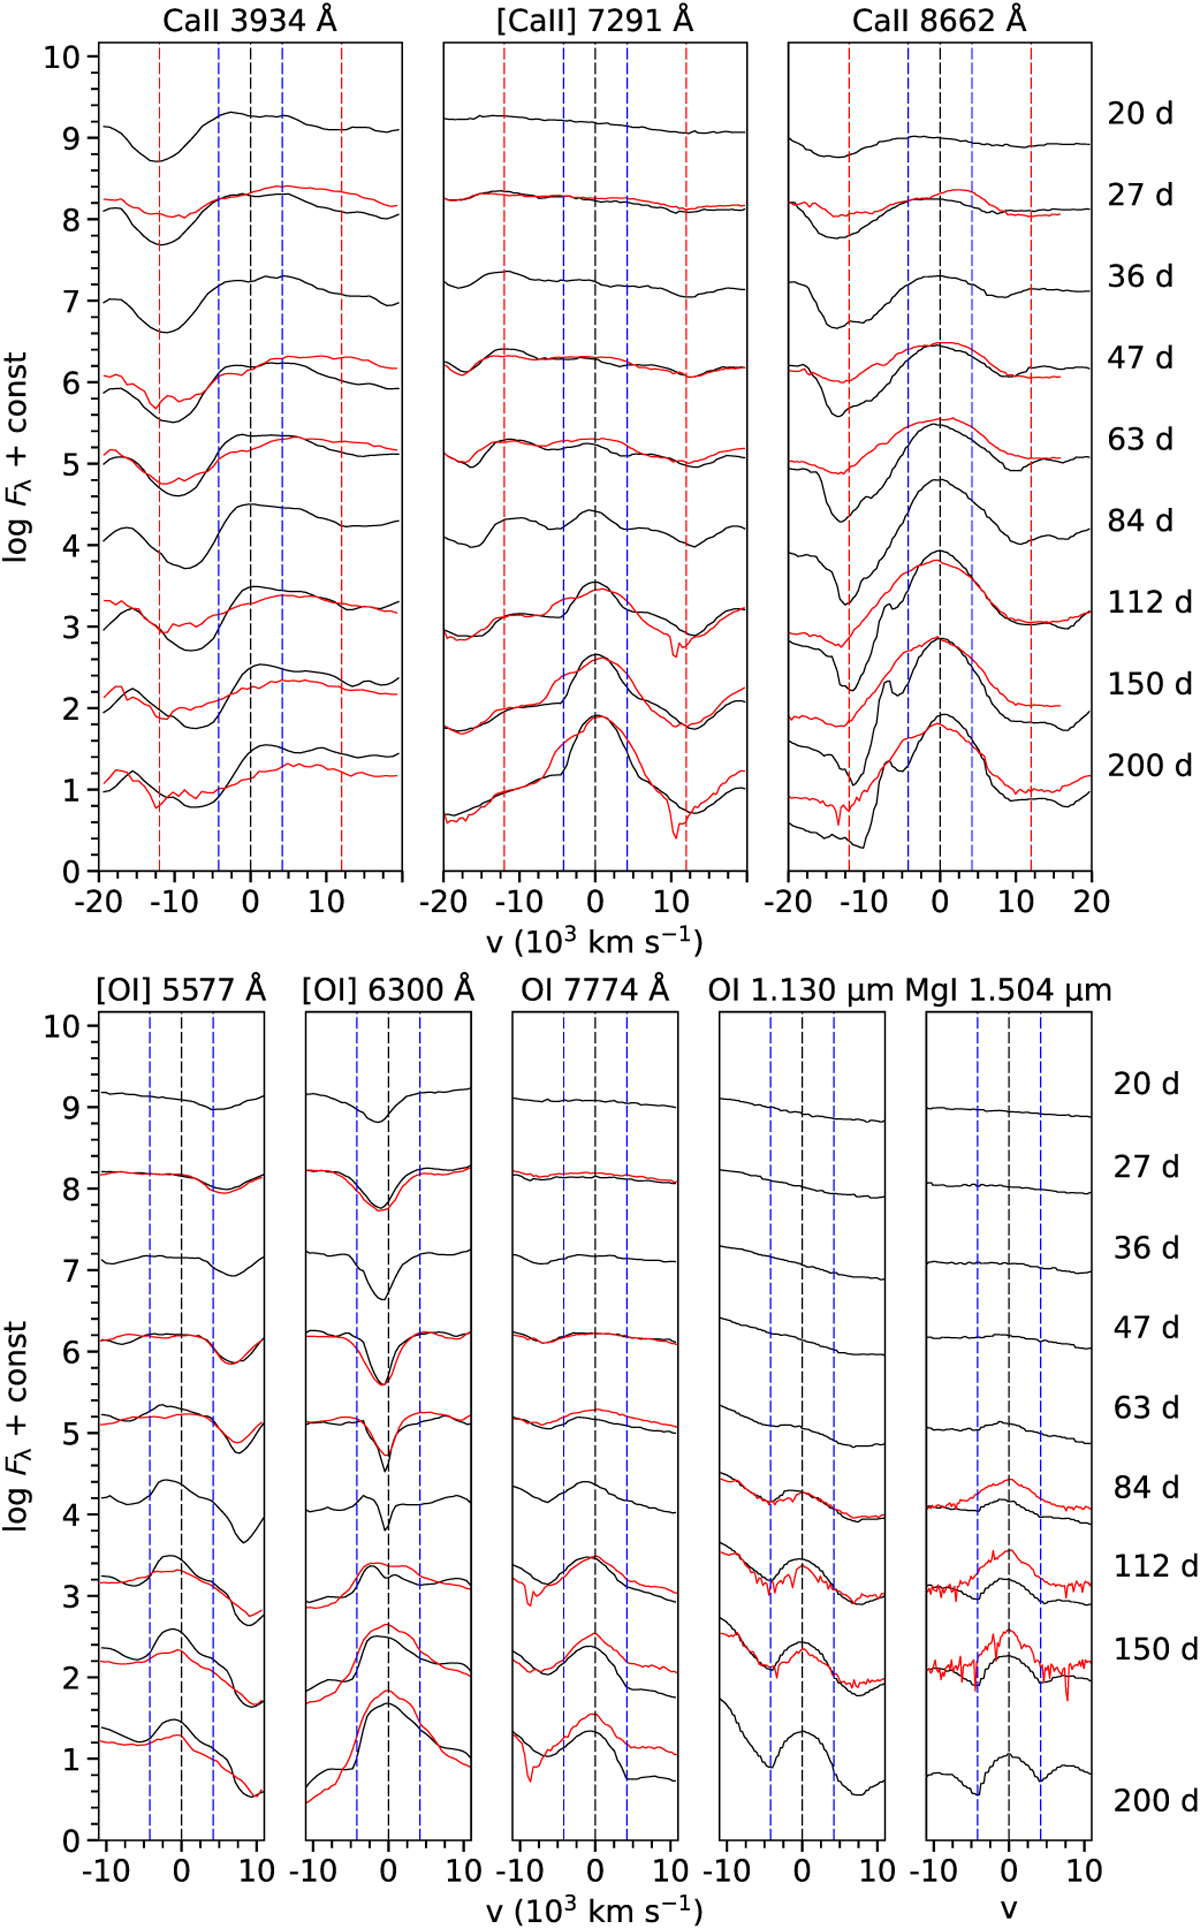
Download original image
Evolution of calcium, oxygen, and magnesium lines for the optimal model (M17-s-s-XH-low; black) compared to the observations of SN 2020acat (red). Spectra from nine logarithmically spaced epochs between 20 and 200 days are shown. The figure is otherwise the same as Fig. 13.
Current usage metrics show cumulative count of Article Views (full-text article views including HTML views, PDF and ePub downloads, according to the available data) and Abstracts Views on Vision4Press platform.
Data correspond to usage on the plateform after 2015. The current usage metrics is available 48-96 hours after online publication and is updated daily on week days.
Initial download of the metrics may take a while.