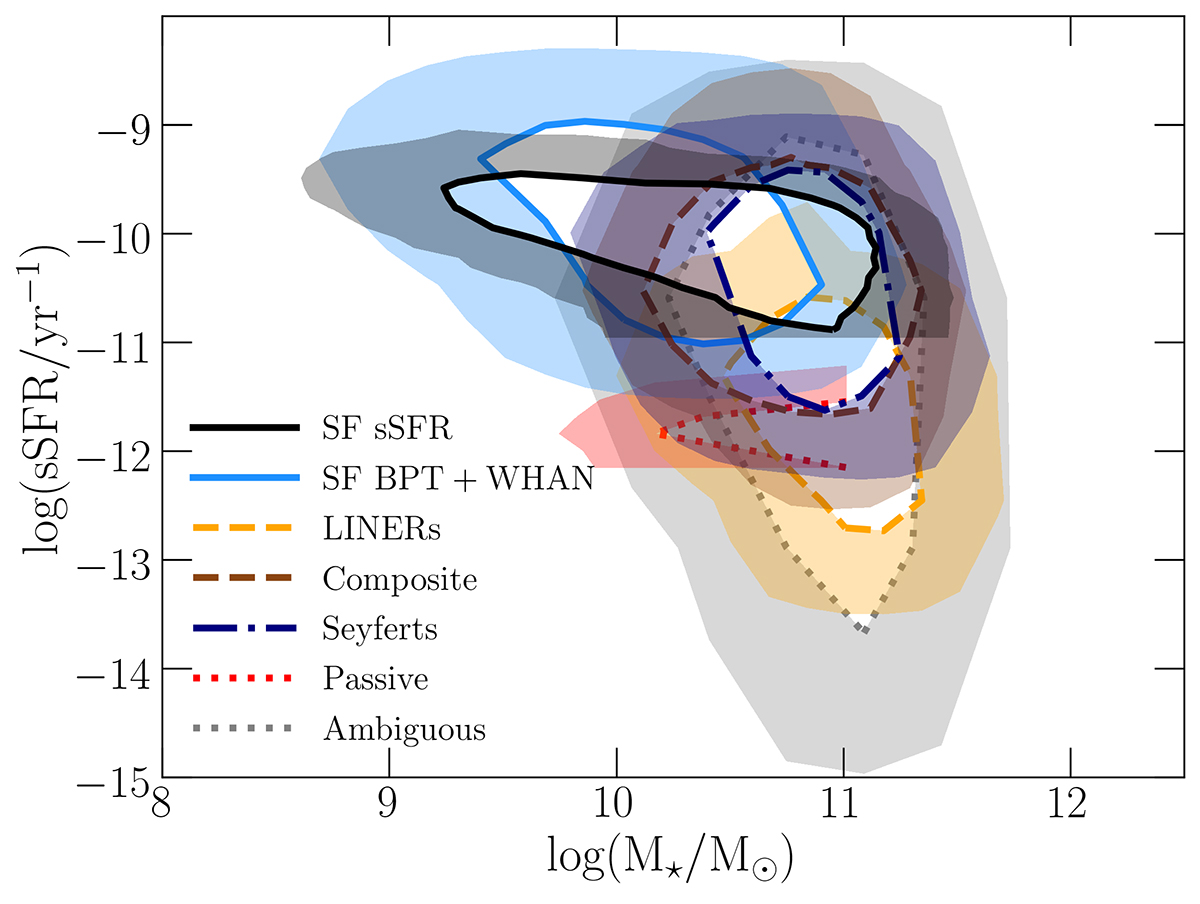
Fig. 9.

Download original image
sSFR as a function of stellar mass for all the main-ELG contributions, each one represented by contours. In each set of contours, the inner line (outer shade) represents the 68 (95) percent confidence regions. The contours of the SF population at sSFR > 10−11 yr−1 (solid black) are broken due to the sharp sSFR cut; those of the passive component (dotted red) are broken due to the very low number density of this population (0.1 percent of the total; see Table 2).
Current usage metrics show cumulative count of Article Views (full-text article views including HTML views, PDF and ePub downloads, according to the available data) and Abstracts Views on Vision4Press platform.
Data correspond to usage on the plateform after 2015. The current usage metrics is available 48-96 hours after online publication and is updated daily on week days.
Initial download of the metrics may take a while.


