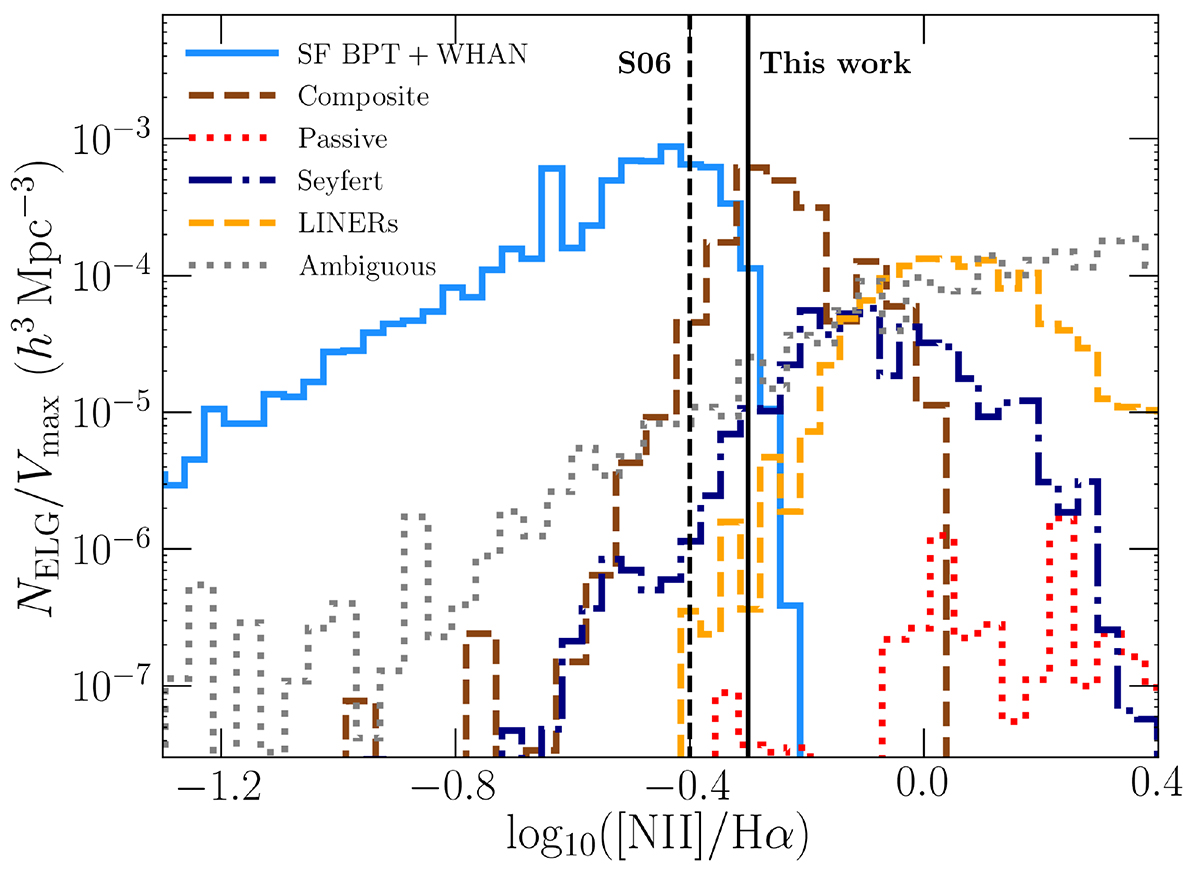
Fig. 8.

Download original image
Volume-weighted distributions of the [N II]/Hα line ratios resulting from our ELG BPT classification. The criteria to separate SF ELGs from the rest, solely based on the ratio [N II]/Hα proposed by Stasińska et al. (2006, S06) is shown by a vertical dashed line, log([N II]/Hα) = −0.4. Our sample is better separated by a slightly different value, log([N II]/Hα) = −0.3, also indicated by a vertical solid line. Note that we do not apply any of these two cuts in our analysis.
Current usage metrics show cumulative count of Article Views (full-text article views including HTML views, PDF and ePub downloads, according to the available data) and Abstracts Views on Vision4Press platform.
Data correspond to usage on the plateform after 2015. The current usage metrics is available 48-96 hours after online publication and is updated daily on week days.
Initial download of the metrics may take a while.


