Fig. 5.

Download original image
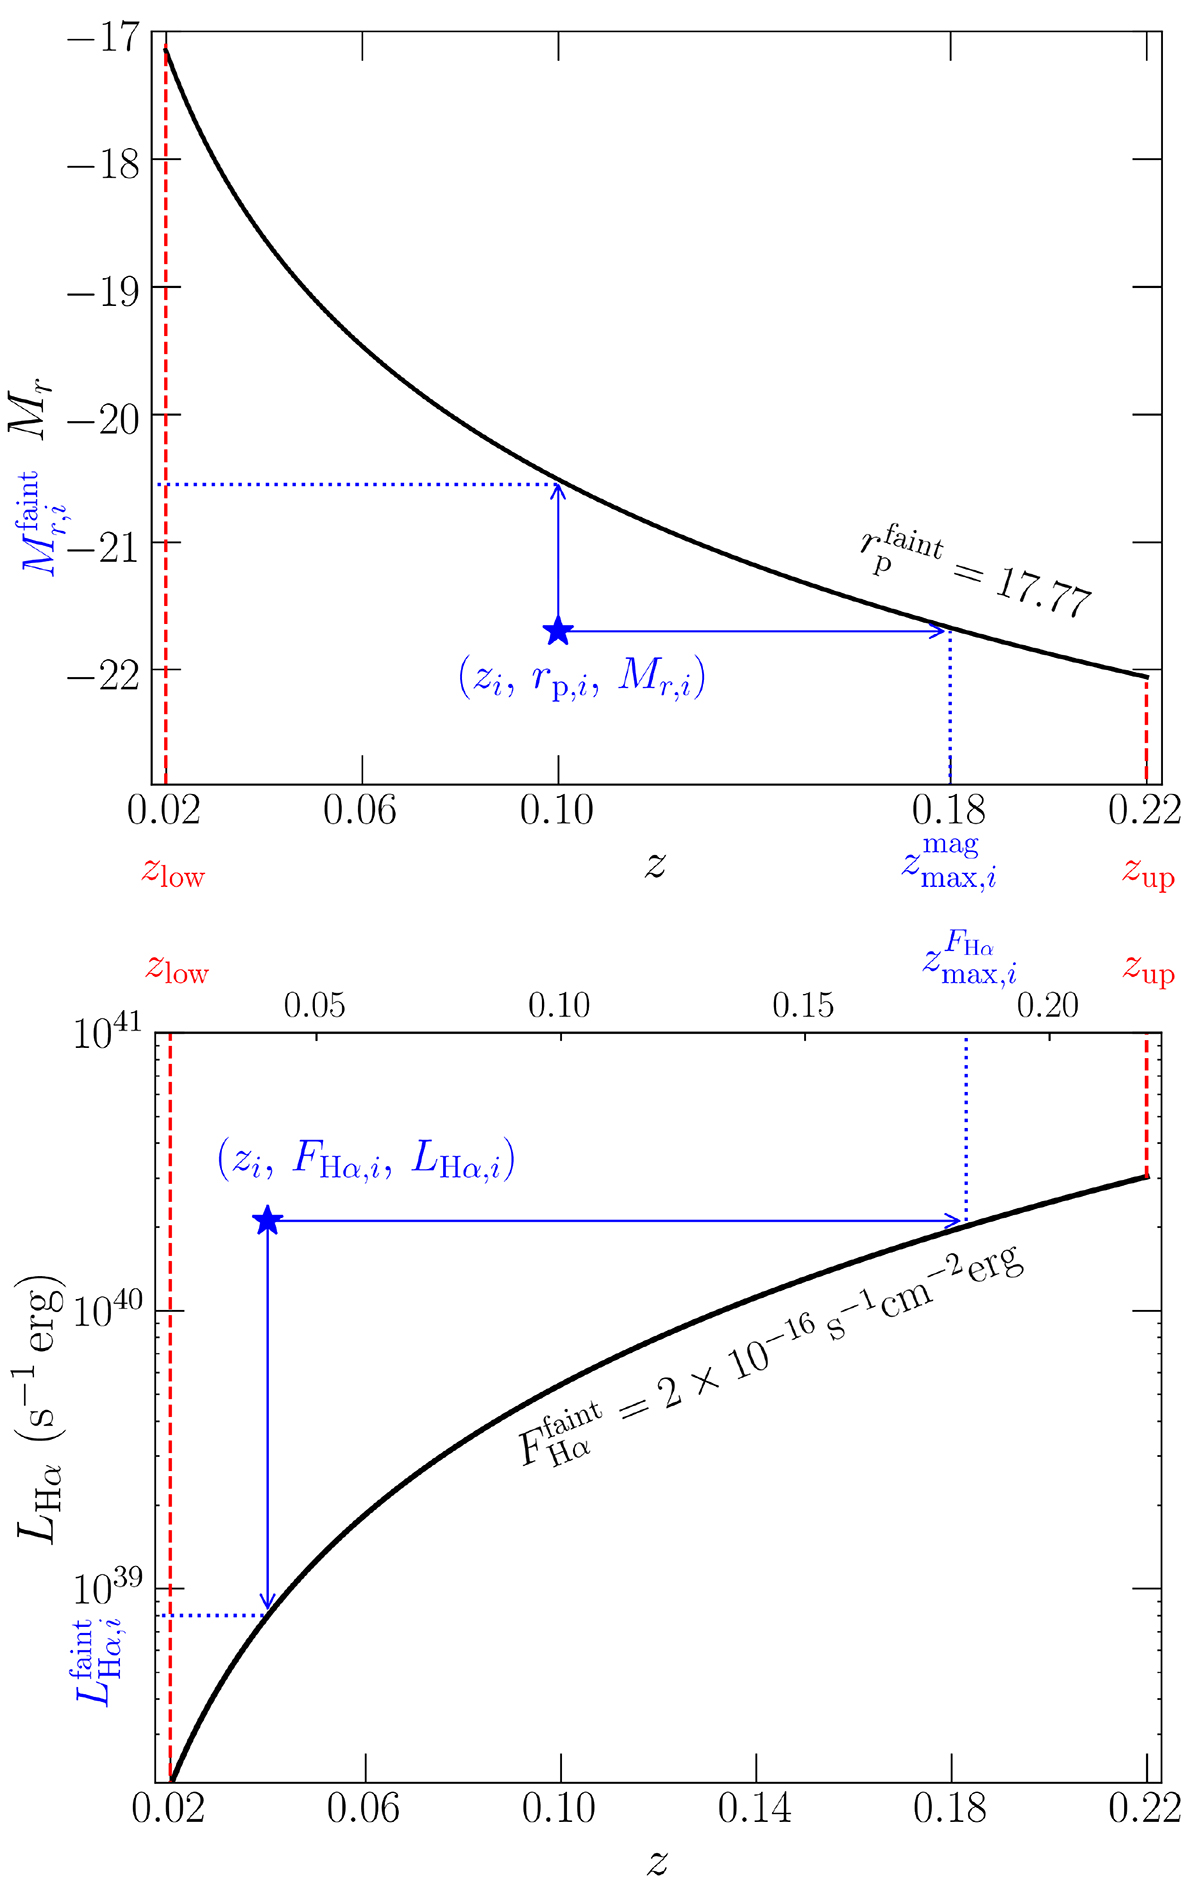
Vmax computation scheme for a galaxy from the main-ELG sample (star symbol). Top panel: we take into account the survey r-band magnitude limit ![]() ; note that we are omitting the K-corrections (K(zi) = 0 in Eq. (8)) for this representation. Bottom panel: similar plot as the top one for a survey with a limit in the Hα line flux of
; note that we are omitting the K-corrections (K(zi) = 0 in Eq. (8)) for this representation. Bottom panel: similar plot as the top one for a survey with a limit in the Hα line flux of ![]() . For the [O II], [O III], Hβ, [N II], and [S II] lines the methodology is identical (see Sect. 2.3). The lower and upper redshift limits of the survey, zlow = 0.02 and zup = 0.22, are highlighted by dashed vertical red lines in both panels. The maximum redshifts that the galaxy can have and still be included in the sample, considering its magnitude and Hα flux limits, as well as the faintest luminosity, are shown by dotted vertical blue lines.
. For the [O II], [O III], Hβ, [N II], and [S II] lines the methodology is identical (see Sect. 2.3). The lower and upper redshift limits of the survey, zlow = 0.02 and zup = 0.22, are highlighted by dashed vertical red lines in both panels. The maximum redshifts that the galaxy can have and still be included in the sample, considering its magnitude and Hα flux limits, as well as the faintest luminosity, are shown by dotted vertical blue lines.
Current usage metrics show cumulative count of Article Views (full-text article views including HTML views, PDF and ePub downloads, according to the available data) and Abstracts Views on Vision4Press platform.
Data correspond to usage on the plateform after 2015. The current usage metrics is available 48-96 hours after online publication and is updated daily on week days.
Initial download of the metrics may take a while.


