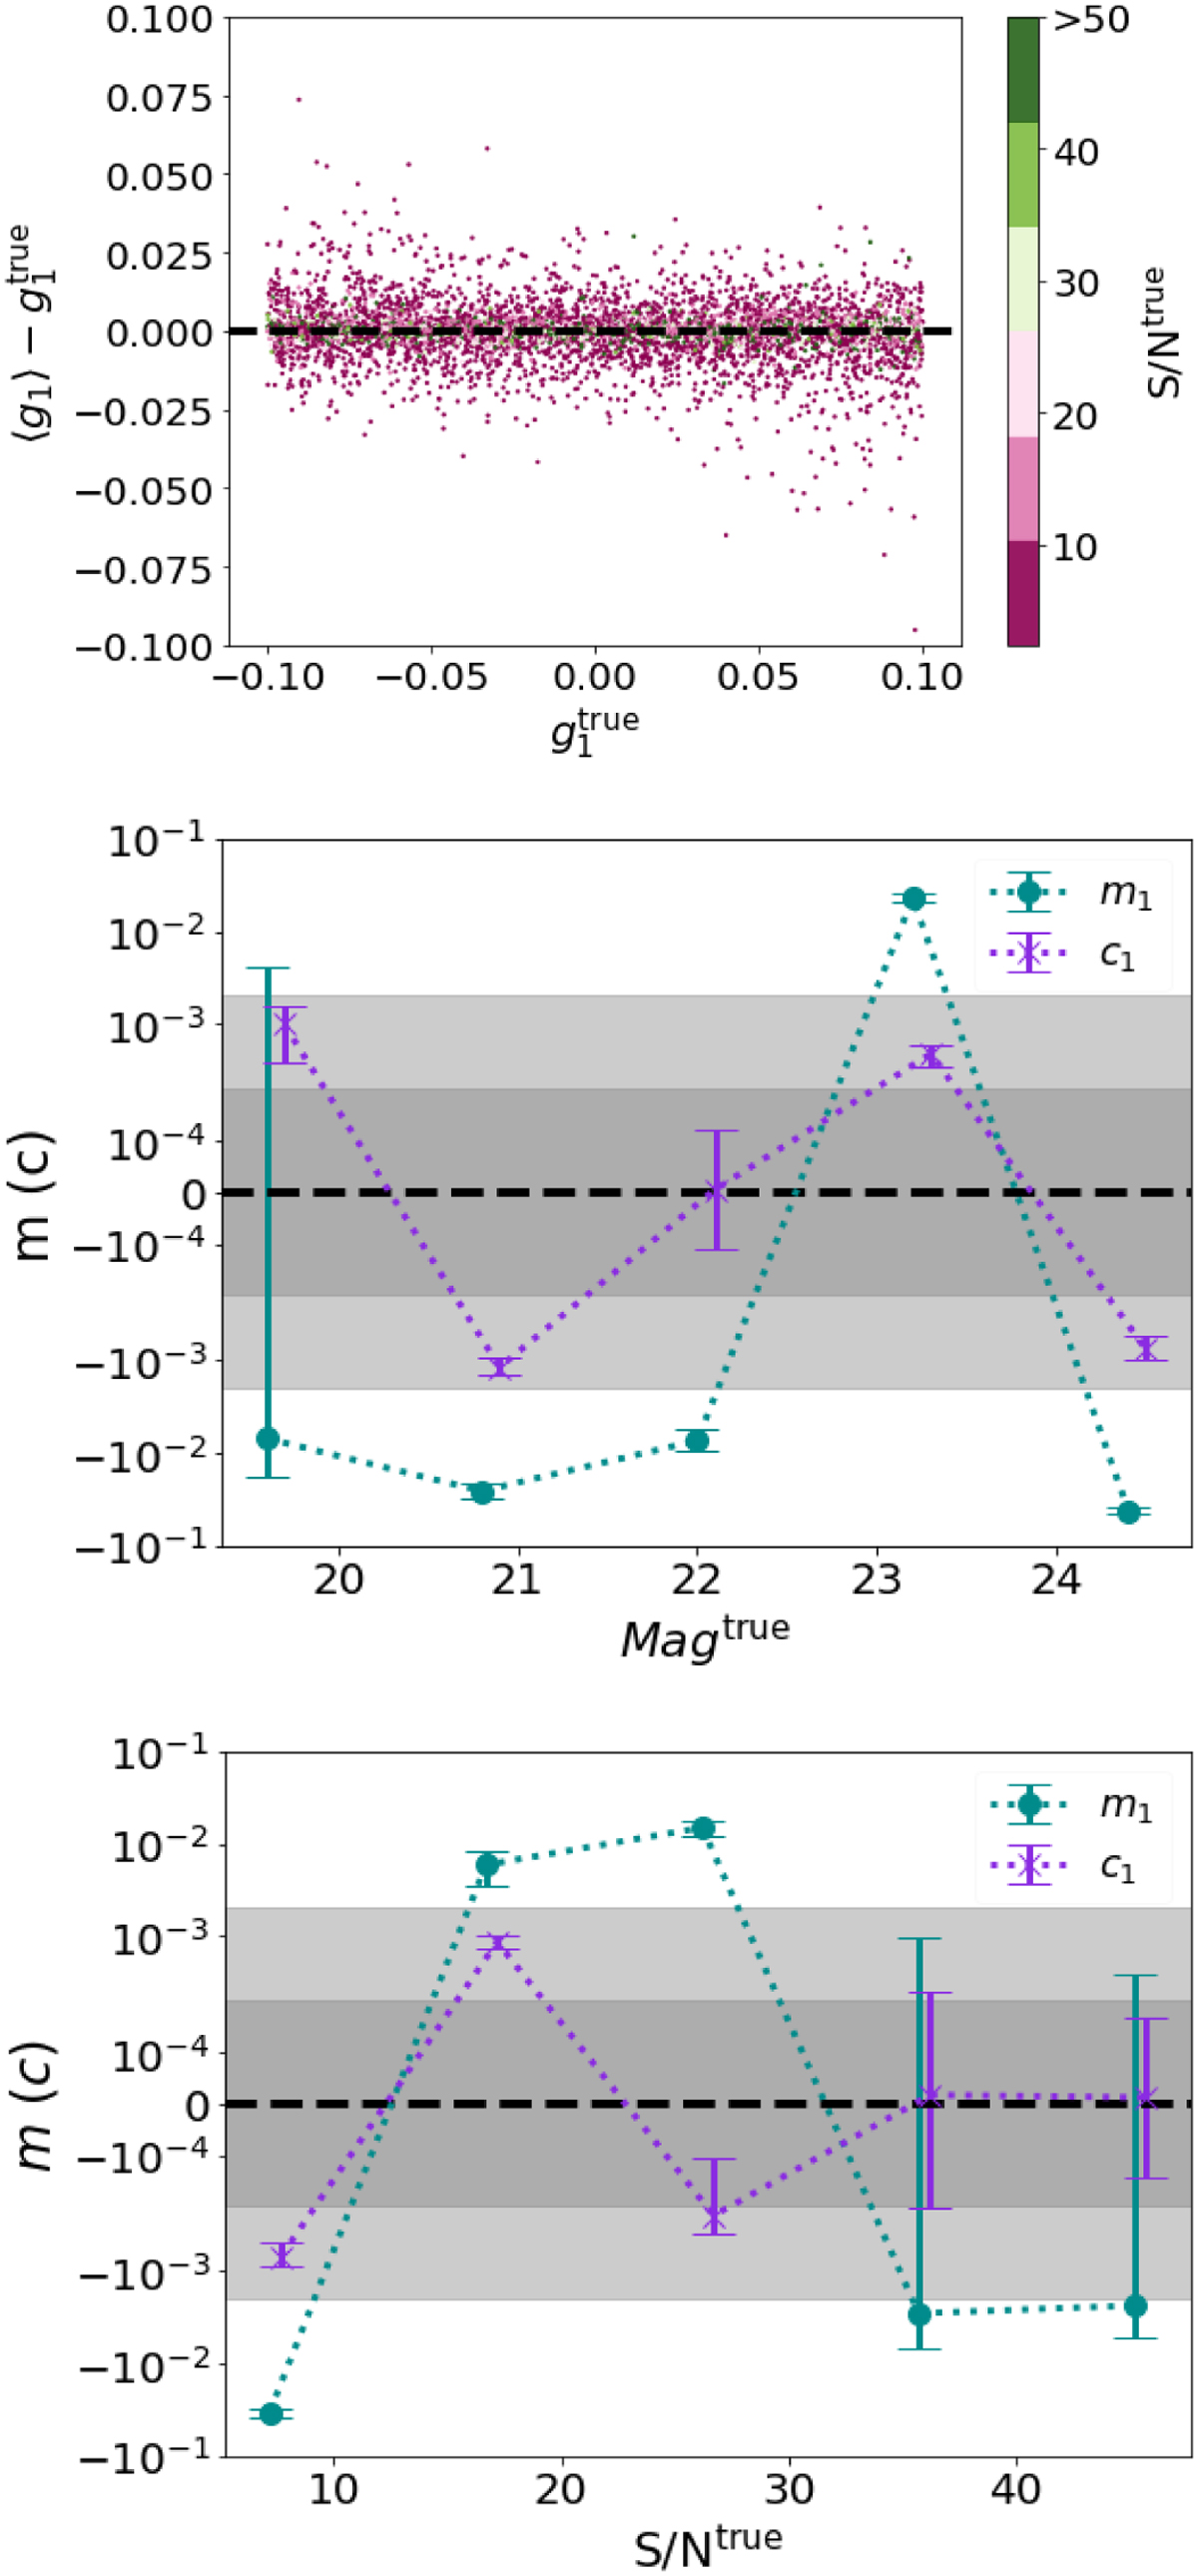
Fig. 9
Download original image
Shear measurement residuals after calibration and binned shear biases as a function of galaxy properties. Top: shear estimation on data described in Fig. 5 after NN calibration. Each point is one “case” with 2000 “realizations” sharing the same axis ratio, size, magnitude, PSF, and shear, but differing in orientation. Middle: multiplicative bias (shown in dark cyan) and additive bias (displayed in blue-violet) are presented as a function of the true galaxy magnitude. The data points from the top panels are categorized into six bins based on the magnitude and fit to a linear function. The y-axis is plotted on a logarithmic scale. The lighter shade corresponds to ±2 × 10⁻³, while the darker shade represents ±2 × 10⁻⁴. Bottom: similar to the middle panel; the m and c are shown as a function of the true galaxy S/N.
Current usage metrics show cumulative count of Article Views (full-text article views including HTML views, PDF and ePub downloads, according to the available data) and Abstracts Views on Vision4Press platform.
Data correspond to usage on the plateform after 2015. The current usage metrics is available 48-96 hours after online publication and is updated daily on week days.
Initial download of the metrics may take a while.