Fig. 12
Download original image
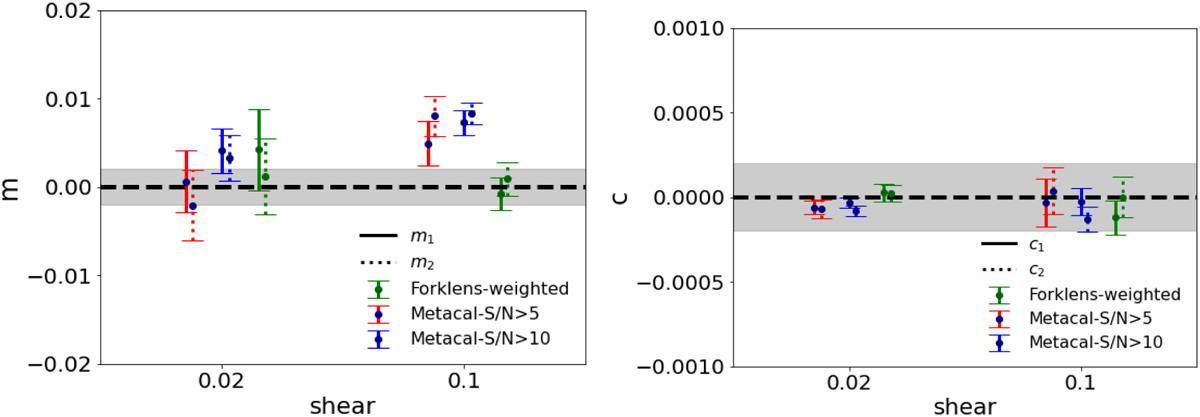
Shear measurement bias with METACALIBRATION and FORKLENS on CSST simulations. Left panel illustrates shear measurement bias m, while right panel represents bias c for both METACALIBRATION and FORKLENS methods on CSST simulation, as a function of the input shear range ([−0.02,0.02] uniformly for a shear of 0.02 and [−0.1,0.1] for a shear of 0.1). Shear biases for the first component are presented with solid error bars, and the second component is depicted with dashed errors. The findings for a shear of 0.02 are obtained from a dataset of 40 million stamps in total (prior to selection) utilizing SNC, and 10 m stamps for 0.1. The gray regions correspond to the requirements set for stage IV weak-lensing experiments, which are 2 × 10⁻³ and 2 × 10⁻⁴ for m and c, respectively.
Current usage metrics show cumulative count of Article Views (full-text article views including HTML views, PDF and ePub downloads, according to the available data) and Abstracts Views on Vision4Press platform.
Data correspond to usage on the plateform after 2015. The current usage metrics is available 48-96 hours after online publication and is updated daily on week days.
Initial download of the metrics may take a while.