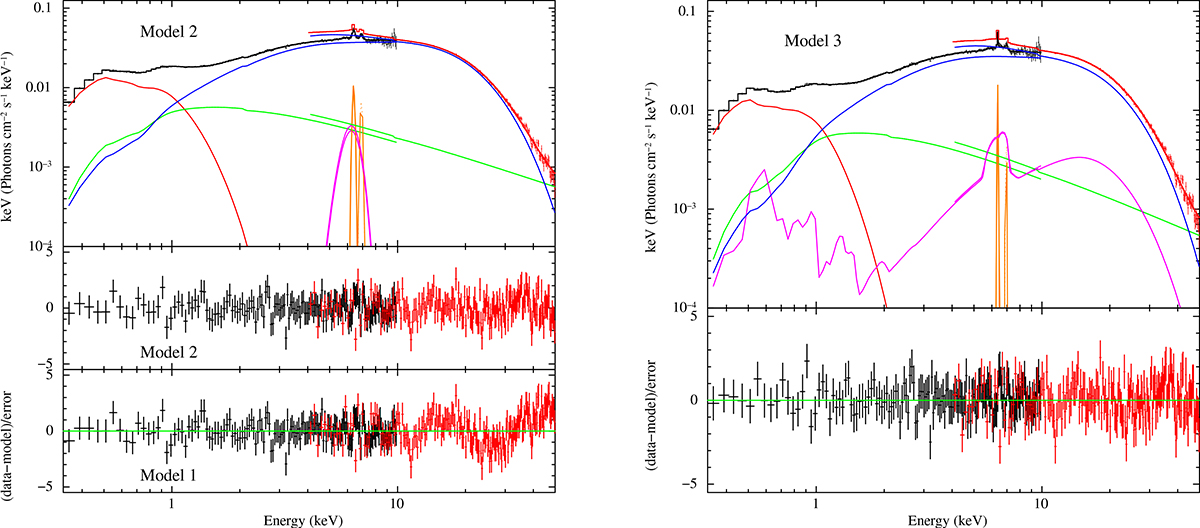
Fig. 16.
Download original image
Unfolded spectrum of Model 2 (top-left panel) using a 0.3–10 keV NICER/XTI spectrum (black color) combined with a 4–50 keV NuSTAR/(FPMA+FPMB) spectrum (red color), the colors of the components are described in the text. Residuals adopting Model 2 and adopting Model 1 are shown in the middle-left panel and bottom-left panel, respectively. Unfolded spectrum and residuals of Model 3 in top-right and bottom-right panel, respectively.
Current usage metrics show cumulative count of Article Views (full-text article views including HTML views, PDF and ePub downloads, according to the available data) and Abstracts Views on Vision4Press platform.
Data correspond to usage on the plateform after 2015. The current usage metrics is available 48-96 hours after online publication and is updated daily on week days.
Initial download of the metrics may take a while.