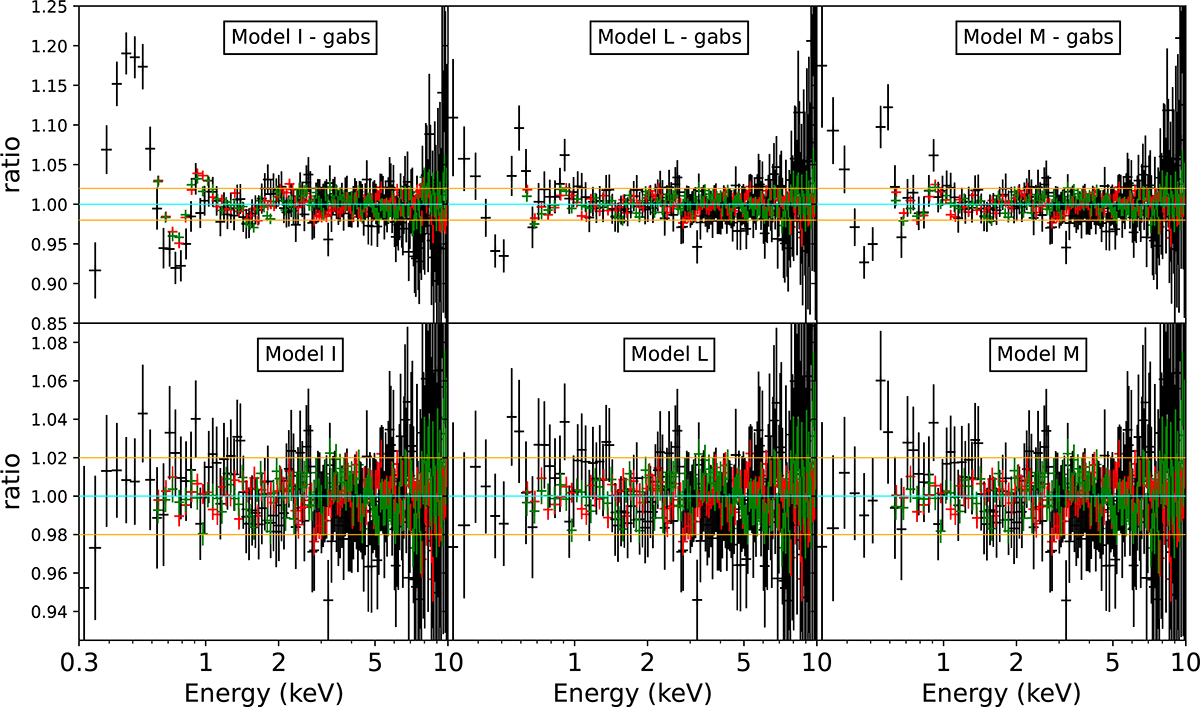
Fig. 14.
Download original image
Ratios combining the 0.3–10 keV NICER (black), PN1 (red) and PN2 (green) spectrum. In the top panels the residuals corresponding to Model I, Model L, and Model M removing the gabs component. In the bottom panels the residuals associated with the best-fit model shown in Table 4. The orange horizontal lines indicate a deviation of the model from the data larger than 2%.
Current usage metrics show cumulative count of Article Views (full-text article views including HTML views, PDF and ePub downloads, according to the available data) and Abstracts Views on Vision4Press platform.
Data correspond to usage on the plateform after 2015. The current usage metrics is available 48-96 hours after online publication and is updated daily on week days.
Initial download of the metrics may take a while.