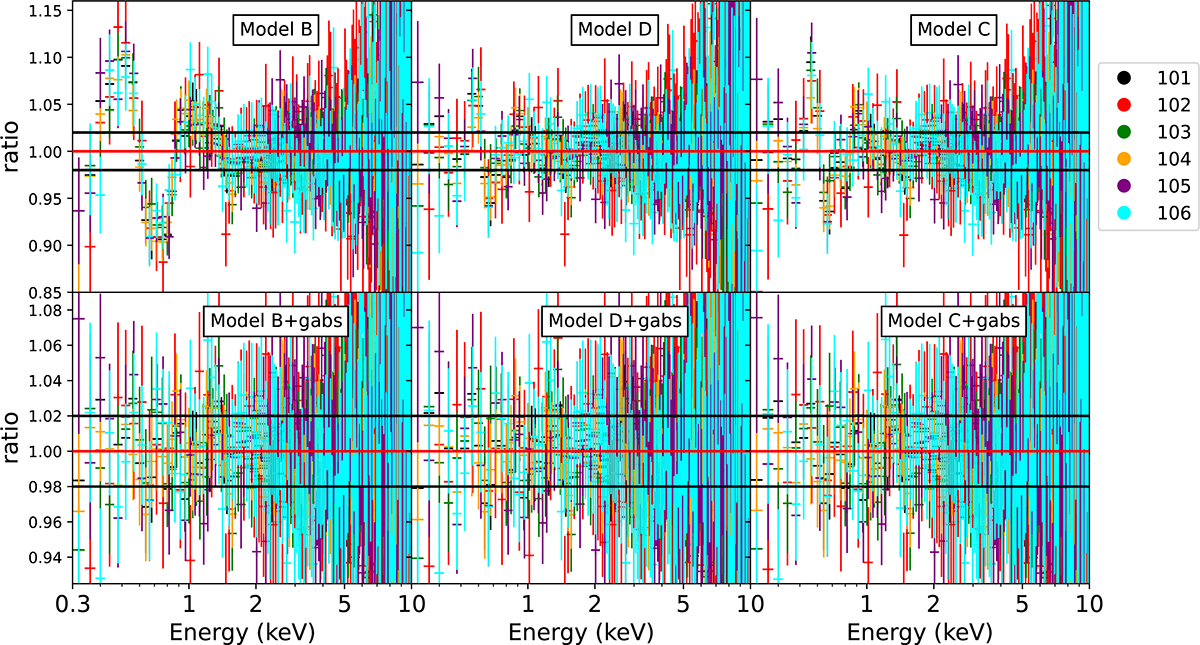
Fig. 10.
Download original image
Data-to-model ratio of the six NICER (0.3–10 keV) spectra with respect to the different adopted models, with or without the gabs component. The adopted colors for each spectrum are shown in the legend in which we indicate the last three digits of the corresponding observation ObsId. In the top panels we show the ratio corresponding to Model B, Model C, and Model D, respectively. In the bottom panels we show the ratio of the same models including a gabs component at 0.7 keV. The black horizontal lines indicate a deviation of the model from the data corresponding to 2%.
Current usage metrics show cumulative count of Article Views (full-text article views including HTML views, PDF and ePub downloads, according to the available data) and Abstracts Views on Vision4Press platform.
Data correspond to usage on the plateform after 2015. The current usage metrics is available 48-96 hours after online publication and is updated daily on week days.
Initial download of the metrics may take a while.