Fig. 7.
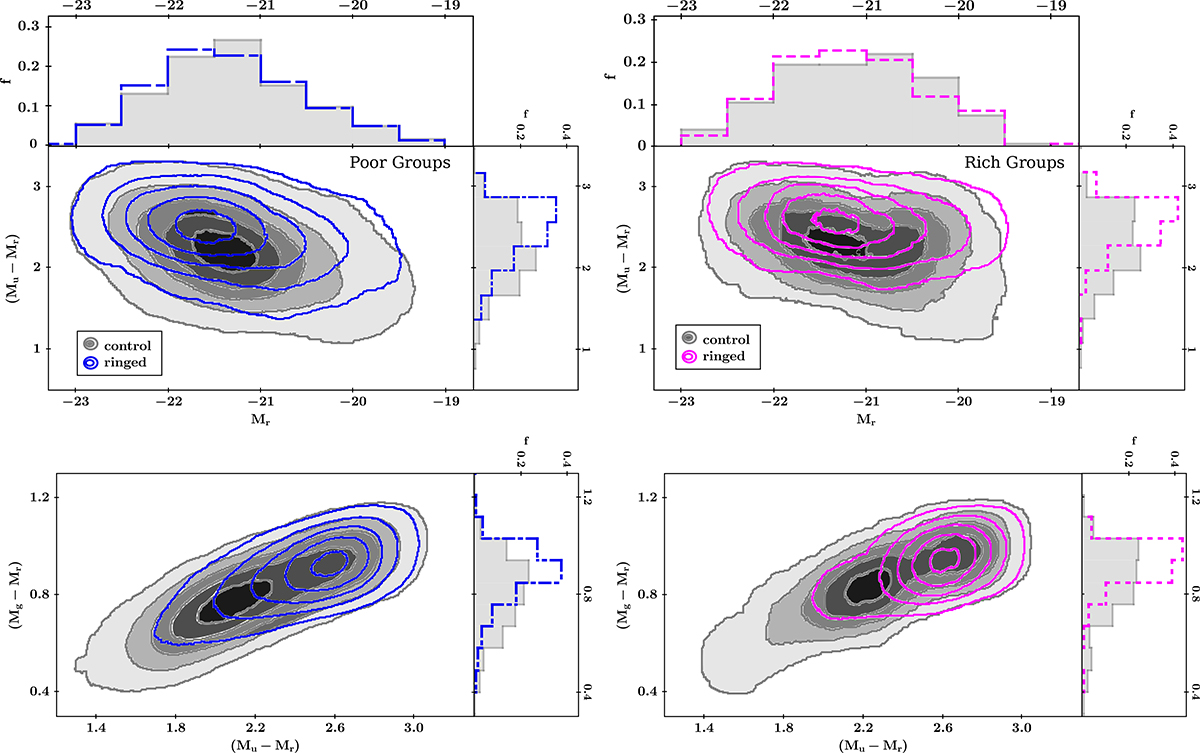
Download original image
Color-magnitude and color-color diagrams for ringed galaxies in groups are displayed. Upper panels: color-magnitude diagrams for ringed galaxies in poor and rich groups (represented by blue and magenta contours, respectively), and their corresponding control samples (represented by gray contours). The vertical panels show the Mu − Mr normalized distributions for each sample. Top-most panels depict the normalized Mr distributions for the same galaxy samples. Lower panels: color-color diagrams for ringed galaxies in poor groups (blue outlines), in rich groups (magenta outlines) and galaxies in their respective control samples (gray surface outlines). The vertical panels show the Mg − Mr normalized distributions for each sample.
Current usage metrics show cumulative count of Article Views (full-text article views including HTML views, PDF and ePub downloads, according to the available data) and Abstracts Views on Vision4Press platform.
Data correspond to usage on the plateform after 2015. The current usage metrics is available 48-96 hours after online publication and is updated daily on week days.
Initial download of the metrics may take a while.