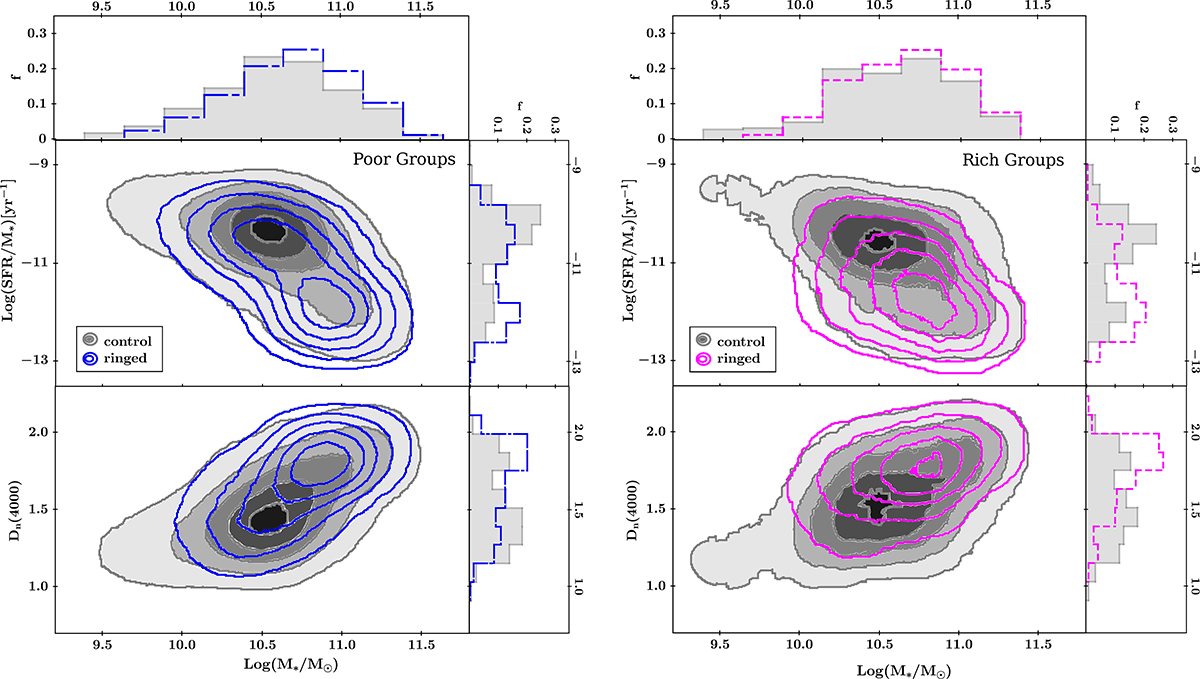
Fig. 3.
Download original image
Log(SFR/M*) and Dn(4000) as a function of stellar masses. Left panels: ringed galaxies in poor groups (represented by blue contours) and their corresponding control sample (represented by gray contours). The side panels show the normalized distributions for each sample. Top-most panel displays the normalized stellar mass distribution for the aforementioned samples. Right panels: same for ringed and non-ringed galaxies in rich groups (represented by magenta and gray contours, respectively).
Current usage metrics show cumulative count of Article Views (full-text article views including HTML views, PDF and ePub downloads, according to the available data) and Abstracts Views on Vision4Press platform.
Data correspond to usage on the plateform after 2015. The current usage metrics is available 48-96 hours after online publication and is updated daily on week days.
Initial download of the metrics may take a while.