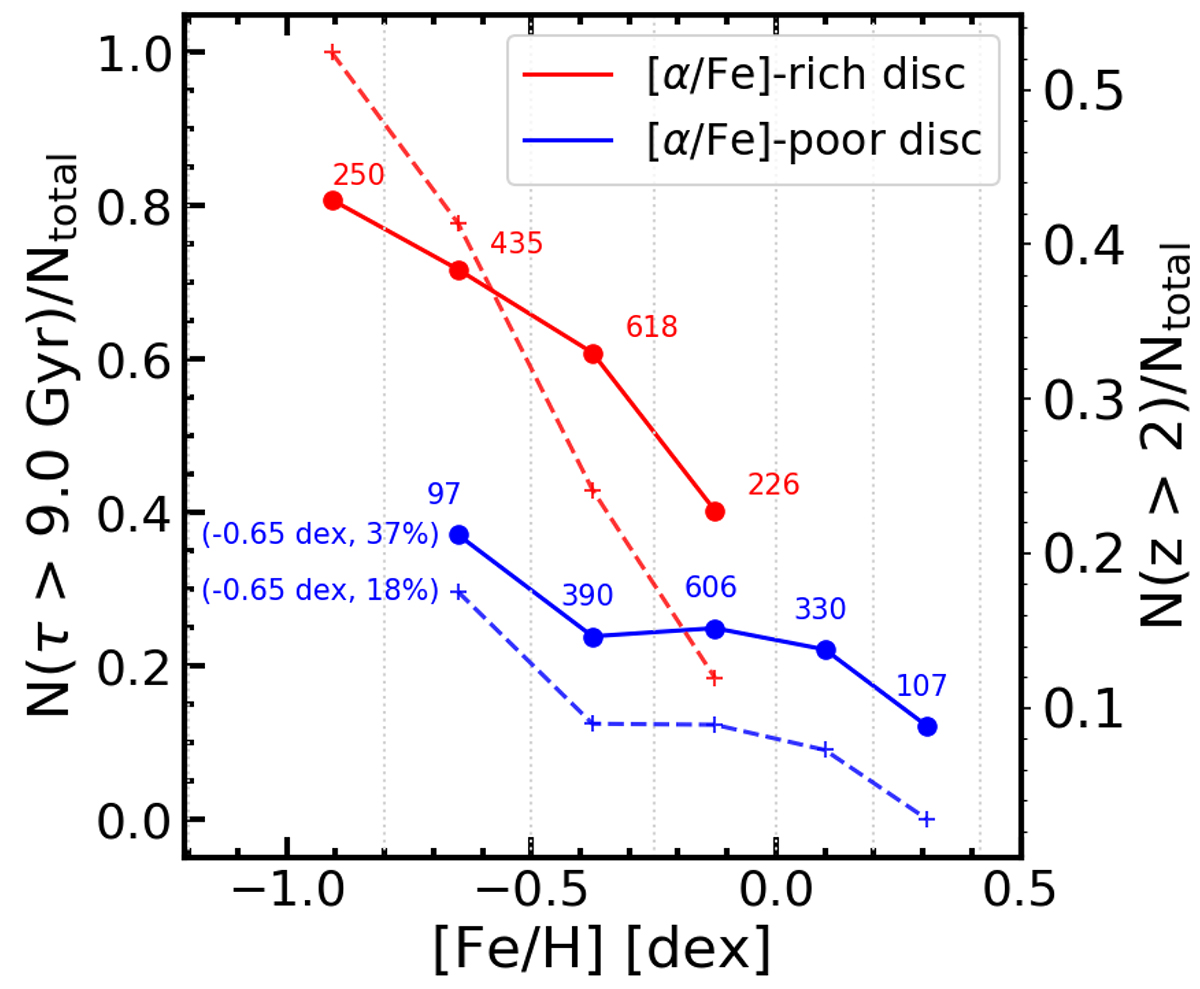
Fig. 8.
Download original image
Number of stars (vertical axis) older than 9 Gyr with respect to the total number (annotated as text) of α-poor, rich stars (respectively) in a given [Fe/H] bin. Grey dotted lines represent [Fe/H] bin boundaries. Blue data represents α-poor stars, red data represents α-rich stars. The solid lines represent the left y-scale: fraction of stars with ages (τ) more than 9 Gyr, the dashed lines represent the right y-scale: fraction of stars with redshift (z) more than 2.
Current usage metrics show cumulative count of Article Views (full-text article views including HTML views, PDF and ePub downloads, according to the available data) and Abstracts Views on Vision4Press platform.
Data correspond to usage on the plateform after 2015. The current usage metrics is available 48-96 hours after online publication and is updated daily on week days.
Initial download of the metrics may take a while.