Open Access
Fig. 7.
Download original image
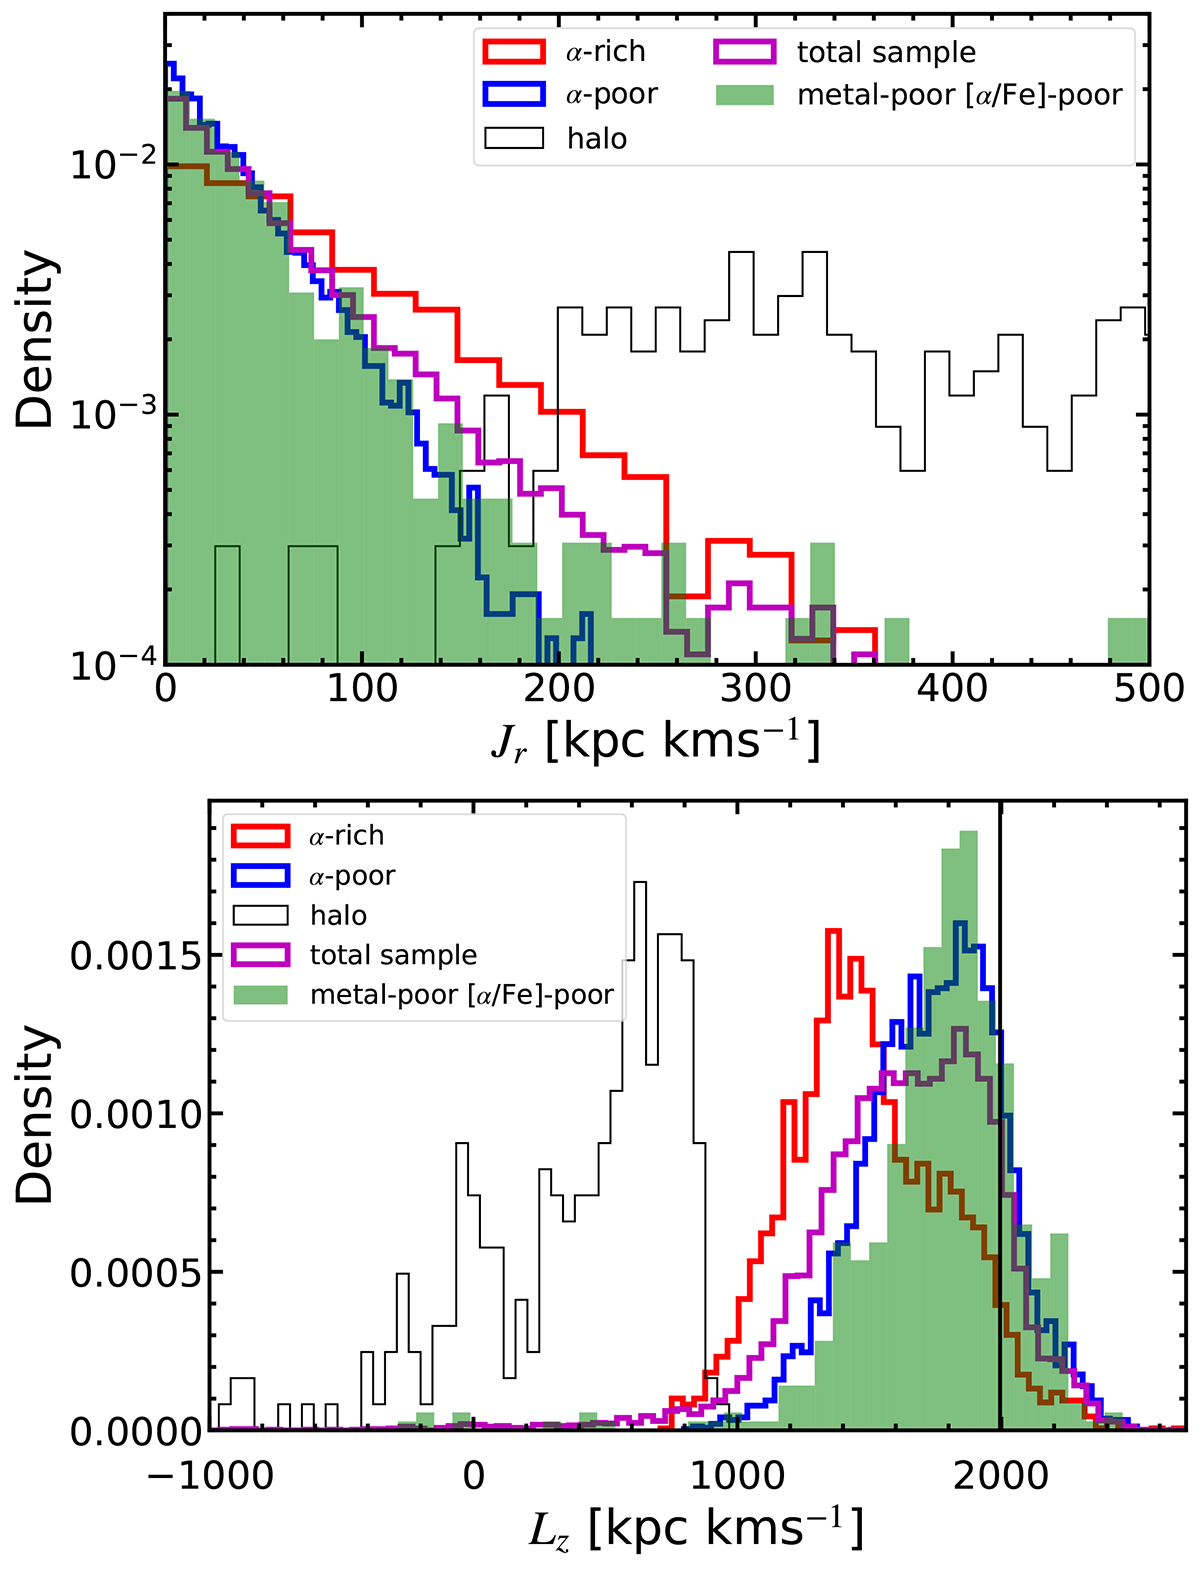
Density distribution in actions Jr and Lz for our identified components. The black line in the lower panel represents the Solar Lz value of 1995 kpc km s−1.
Current usage metrics show cumulative count of Article Views (full-text article views including HTML views, PDF and ePub downloads, according to the available data) and Abstracts Views on Vision4Press platform.
Data correspond to usage on the plateform after 2015. The current usage metrics is available 48-96 hours after online publication and is updated daily on week days.
Initial download of the metrics may take a while.