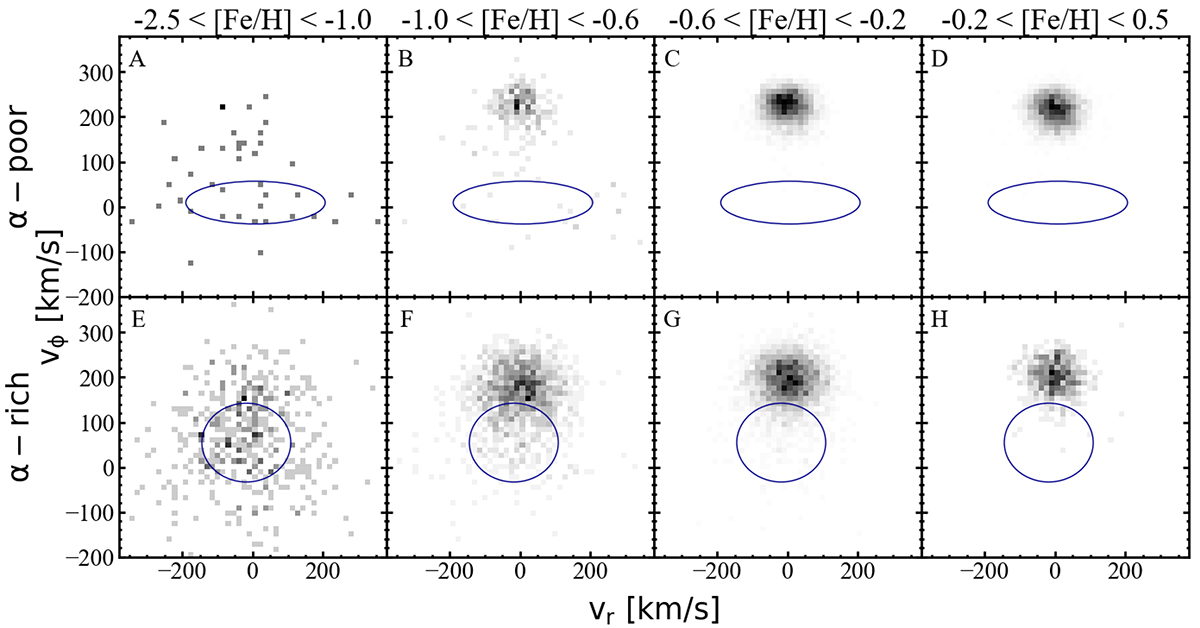
Fig. 6.
Download original image
Phase-space of the observed Gaia-ESO sample: azimuthal velocity, Vϕ, versus radial velocity, Vr, coloured in density. The upper panels represent the α-poor population, and the lower panels represent the α-rich population. Each population is split into two [Fe/H] bins: metal-poor and metal solar-rich. The blue ellipse represents the halo distribution following the multi-Gaussian approach described in Belokurov et al. (2018) to determine halo contamination within the disc.
Current usage metrics show cumulative count of Article Views (full-text article views including HTML views, PDF and ePub downloads, according to the available data) and Abstracts Views on Vision4Press platform.
Data correspond to usage on the plateform after 2015. The current usage metrics is available 48-96 hours after online publication and is updated daily on week days.
Initial download of the metrics may take a while.