Fig. B.1.
Download original image
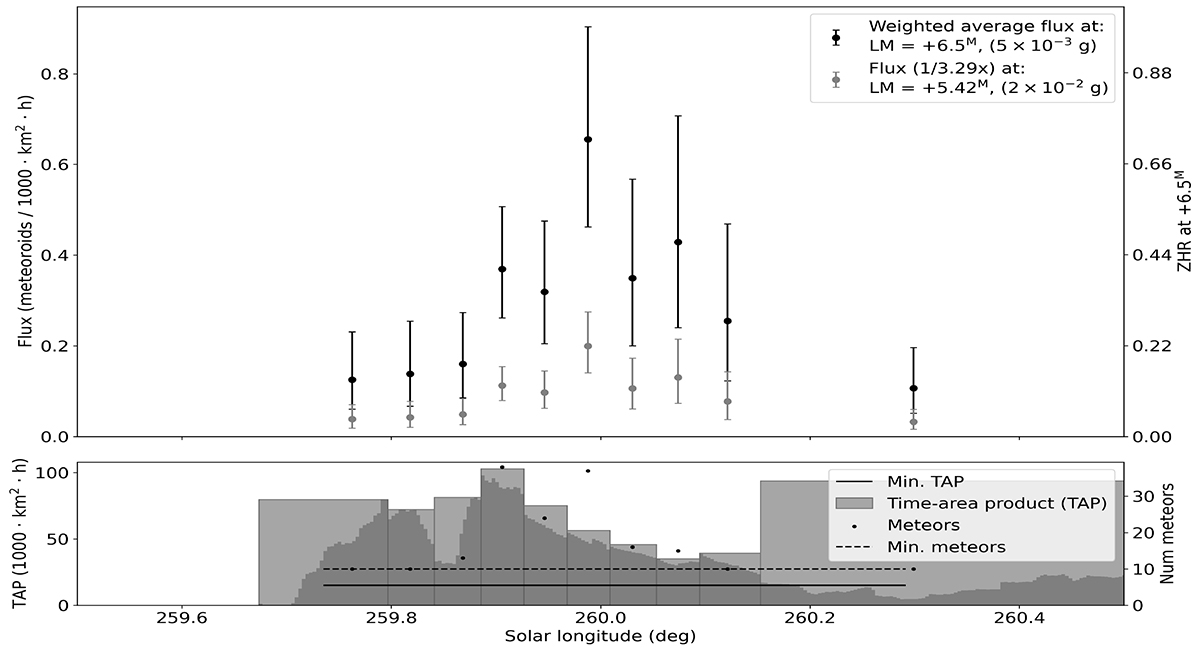
Flux profile of the λ-Sculpturids. The top inset shows the flux at two different limiting magnitudes: black markers for the standard +6.5 and gray markers for the observed mean of +5.42. The bottom inset shows the observed time-area product (TAP) and the observed number of meteors, together with the thresholds set on both. The dark gray shading inside individual TAP bins shows the distribution of TAP inside each bin, revealing any potential gaps in coverage.
Current usage metrics show cumulative count of Article Views (full-text article views including HTML views, PDF and ePub downloads, according to the available data) and Abstracts Views on Vision4Press platform.
Data correspond to usage on the plateform after 2015. The current usage metrics is available 48-96 hours after online publication and is updated daily on week days.
Initial download of the metrics may take a while.