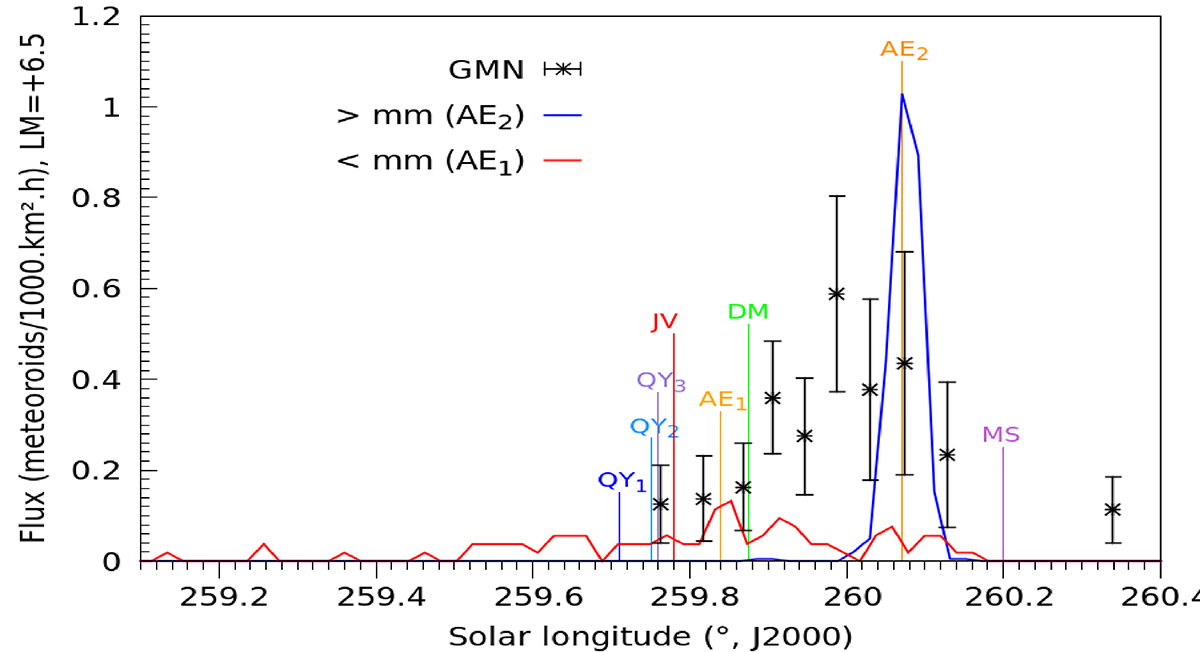
Fig. 2.
Download original image
Comparison between the observed flux profile of the λ-Sculptorids with the predictions of Vaubaillon et al. (2023). Coloured lines indicate the maximum activity time predicted by the different models presented in Table 2 of Vaubaillon et al. (2023), and marked by the initials of the co-authors. The solid lines illustrate the modeled activity predicted by AE for particles with sizes above (blue) or below (red) one millimetre, with nodal-crossing locations closer than 0.02 AU from the Earth’s orbit at the time of the shower (AE1 model). The black symbols represent the flux measured by GMN at a limiting magnitude of +6.5.
Current usage metrics show cumulative count of Article Views (full-text article views including HTML views, PDF and ePub downloads, according to the available data) and Abstracts Views on Vision4Press platform.
Data correspond to usage on the plateform after 2015. The current usage metrics is available 48-96 hours after online publication and is updated daily on week days.
Initial download of the metrics may take a while.