Fig. A.1.
Download original image
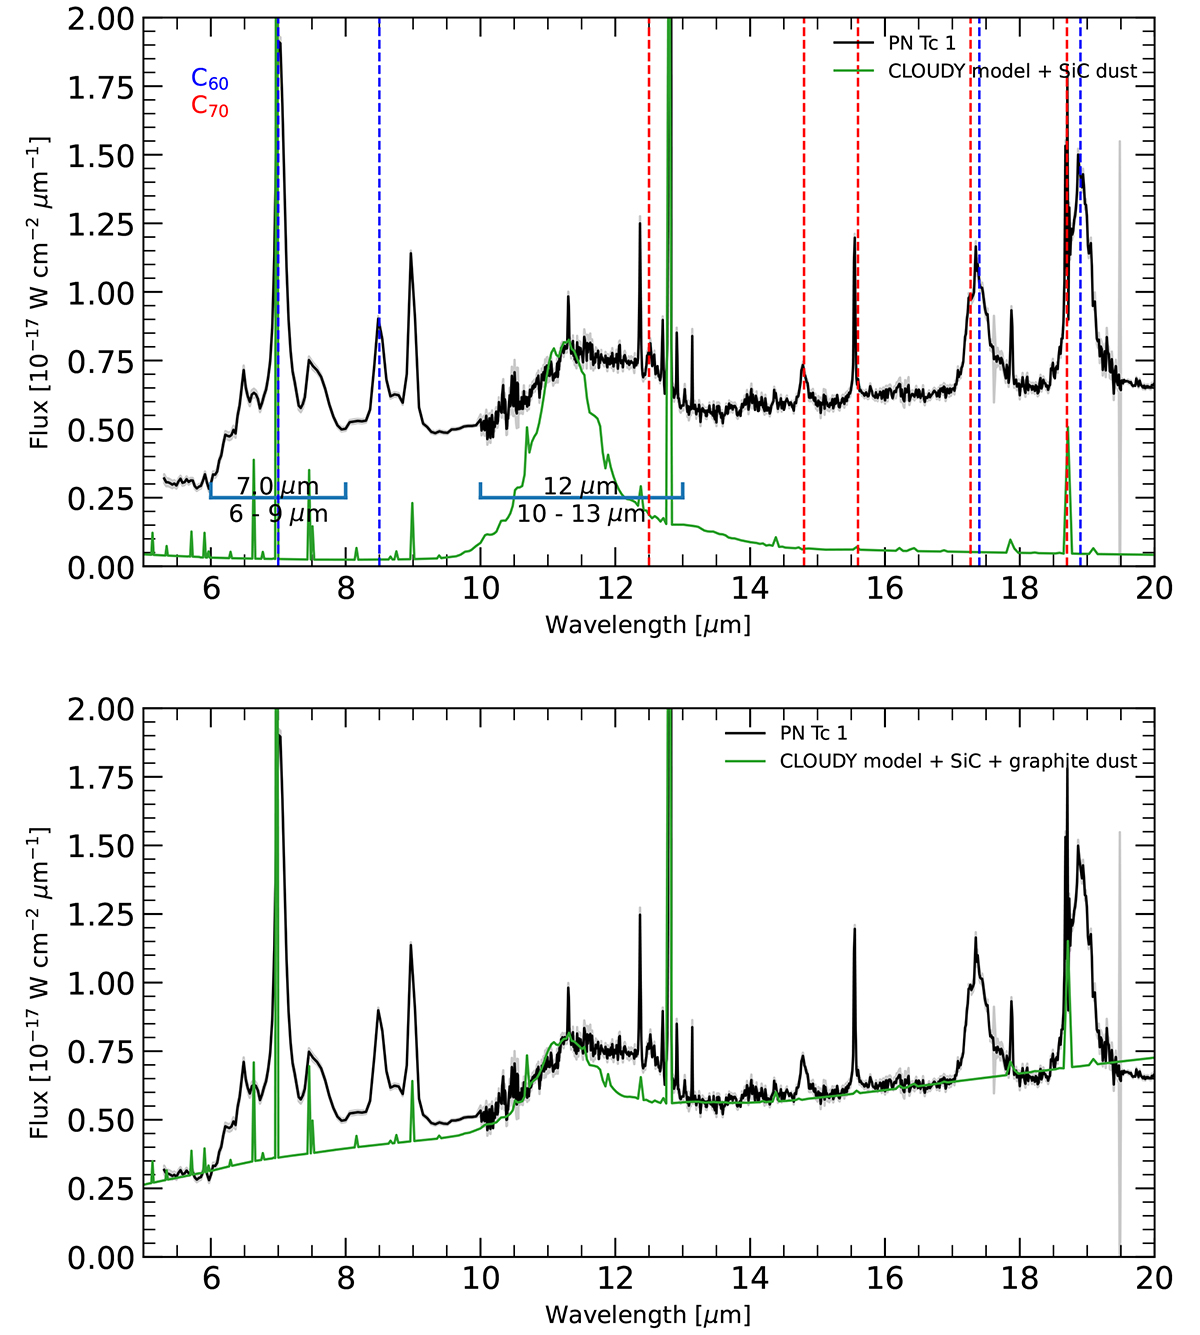
Spitzer mid-IR spectrum of the PN Tc 1 (black line) compared with the best photoionization model spectrum including α-SiC dust grains only (green line ) are shown (top panel). The C60 (blue line) and C70 (red line) emission bands and UIR plateau emission features are indicated. We note that the narrow emission features seen in the best model spectrum (green line) are just atomic nebular emission lines, whose detailed modeling is out of the scope of the present work. The best photoionization model including α-SiC grains in conjunction with graphite dust grains (green line) is also shown for comparison (bottom panel).
Current usage metrics show cumulative count of Article Views (full-text article views including HTML views, PDF and ePub downloads, according to the available data) and Abstracts Views on Vision4Press platform.
Data correspond to usage on the plateform after 2015. The current usage metrics is available 48-96 hours after online publication and is updated daily on week days.
Initial download of the metrics may take a while.