Fig. 3.
Download original image
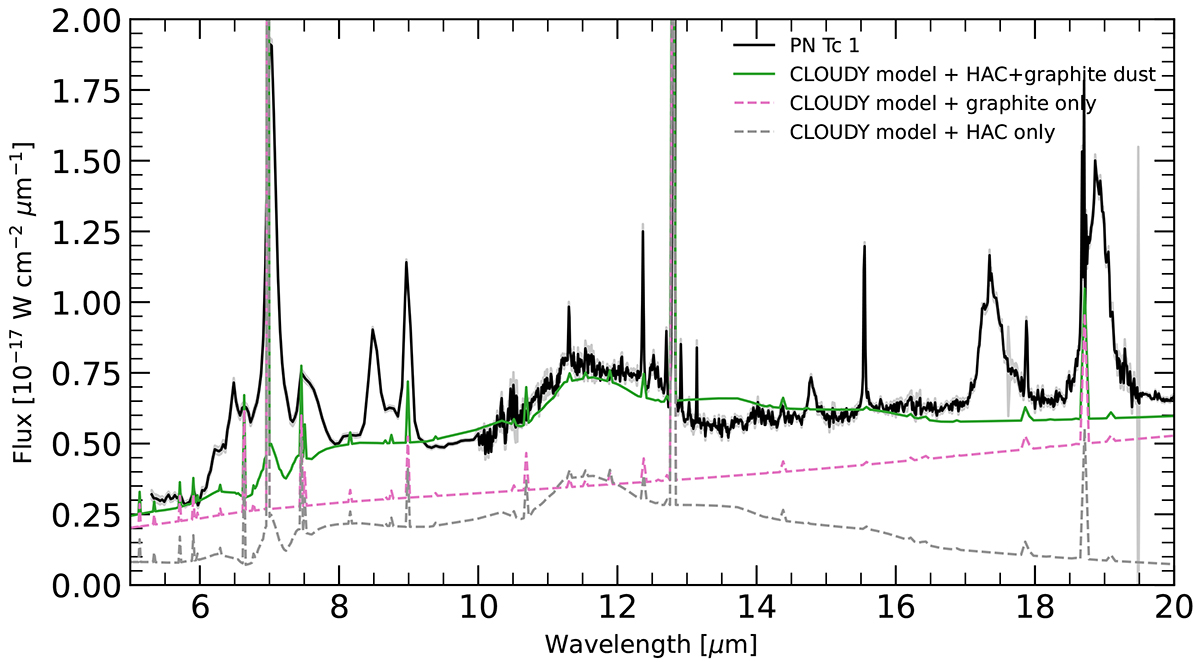
Spitzer mid-IR spectrum of the PN Tc 1 (black line) compared with the best photoionization model spectra for HAC-like (dashed gray line) and graphite (dashed magenta line) dust grains separately. The best photoionization model including HAC-like grains in conjunction with graphite dust grains (solid green line) is also shown for comparison.
Current usage metrics show cumulative count of Article Views (full-text article views including HTML views, PDF and ePub downloads, according to the available data) and Abstracts Views on Vision4Press platform.
Data correspond to usage on the plateform after 2015. The current usage metrics is available 48-96 hours after online publication and is updated daily on week days.
Initial download of the metrics may take a while.