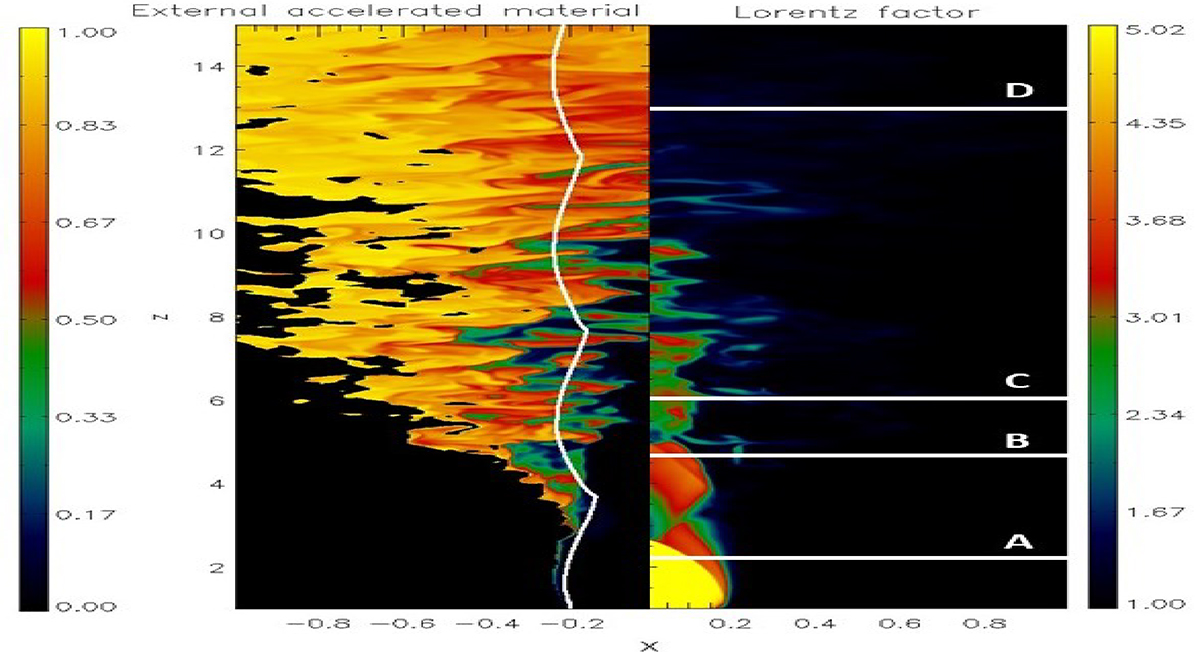
Fig. 2.
Download original image
Two pictures displaying the maps of the Lorentz factor (right panel) and of the tracer of the medium material (left panel) that is accelerated above a threshold of vz ≥ 0.1 in the x − z plane, at y = 0. The white curve on the left is a contour of the 2D stationary jet. White horizontal lines on the right indicate four different distances z* at which we evaluate the x − y cuts in Fig. 3.
Current usage metrics show cumulative count of Article Views (full-text article views including HTML views, PDF and ePub downloads, according to the available data) and Abstracts Views on Vision4Press platform.
Data correspond to usage on the plateform after 2015. The current usage metrics is available 48-96 hours after online publication and is updated daily on week days.
Initial download of the metrics may take a while.