Fig. A.4.
Download original image
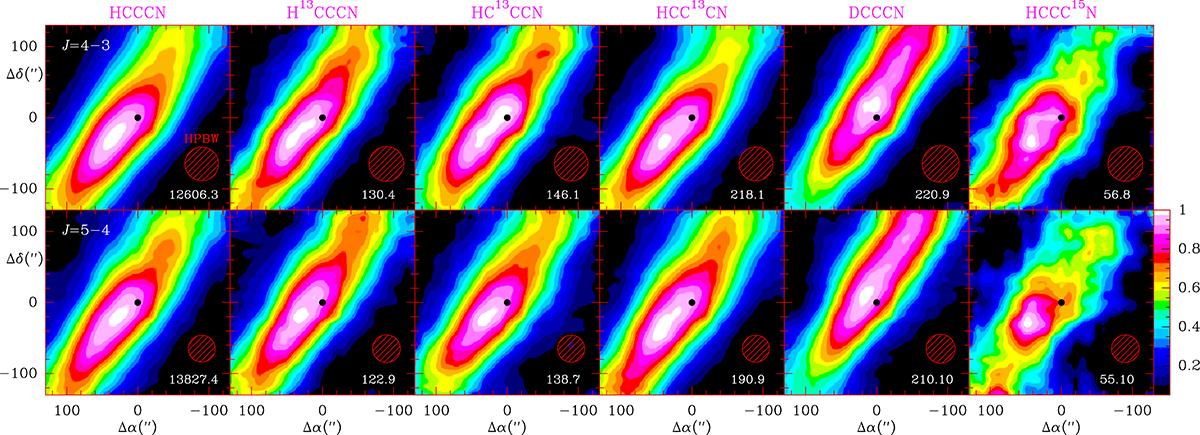
Colour plot of the spatial distribution of the integrated intensity between 5.3 km s−1 and 6.5 km s−1 of the J = 4 − 3 and J = 5 − 4 lines of HCCCN and its singly substituted isotopologues detected in the SANCHO survey. The sampling of the data is 20″, and the integrating area in each position corresponds to a circle with a radius of 20″ (see Sect. 4). For each species, the integrated intensity has been normalized to the maximum value within the area covered by the map. The colour scale is therefore the same for all species and is indicated by the wedge in the lower right part of the figure. The maximum intensities (in mK km s−1) are indicated in the bottom right corner of each panel. The HPBW of the telescope is also indicated in the bottom right corner of each map. The black dot indicates the centre of the map, which corresponds to the QUIJOTE survey position, i.e. the cyanopolyyne peak of TMC-1.
Current usage metrics show cumulative count of Article Views (full-text article views including HTML views, PDF and ePub downloads, according to the available data) and Abstracts Views on Vision4Press platform.
Data correspond to usage on the plateform after 2015. The current usage metrics is available 48-96 hours after online publication and is updated daily on week days.
Initial download of the metrics may take a while.