Fig. A.2.
Download original image
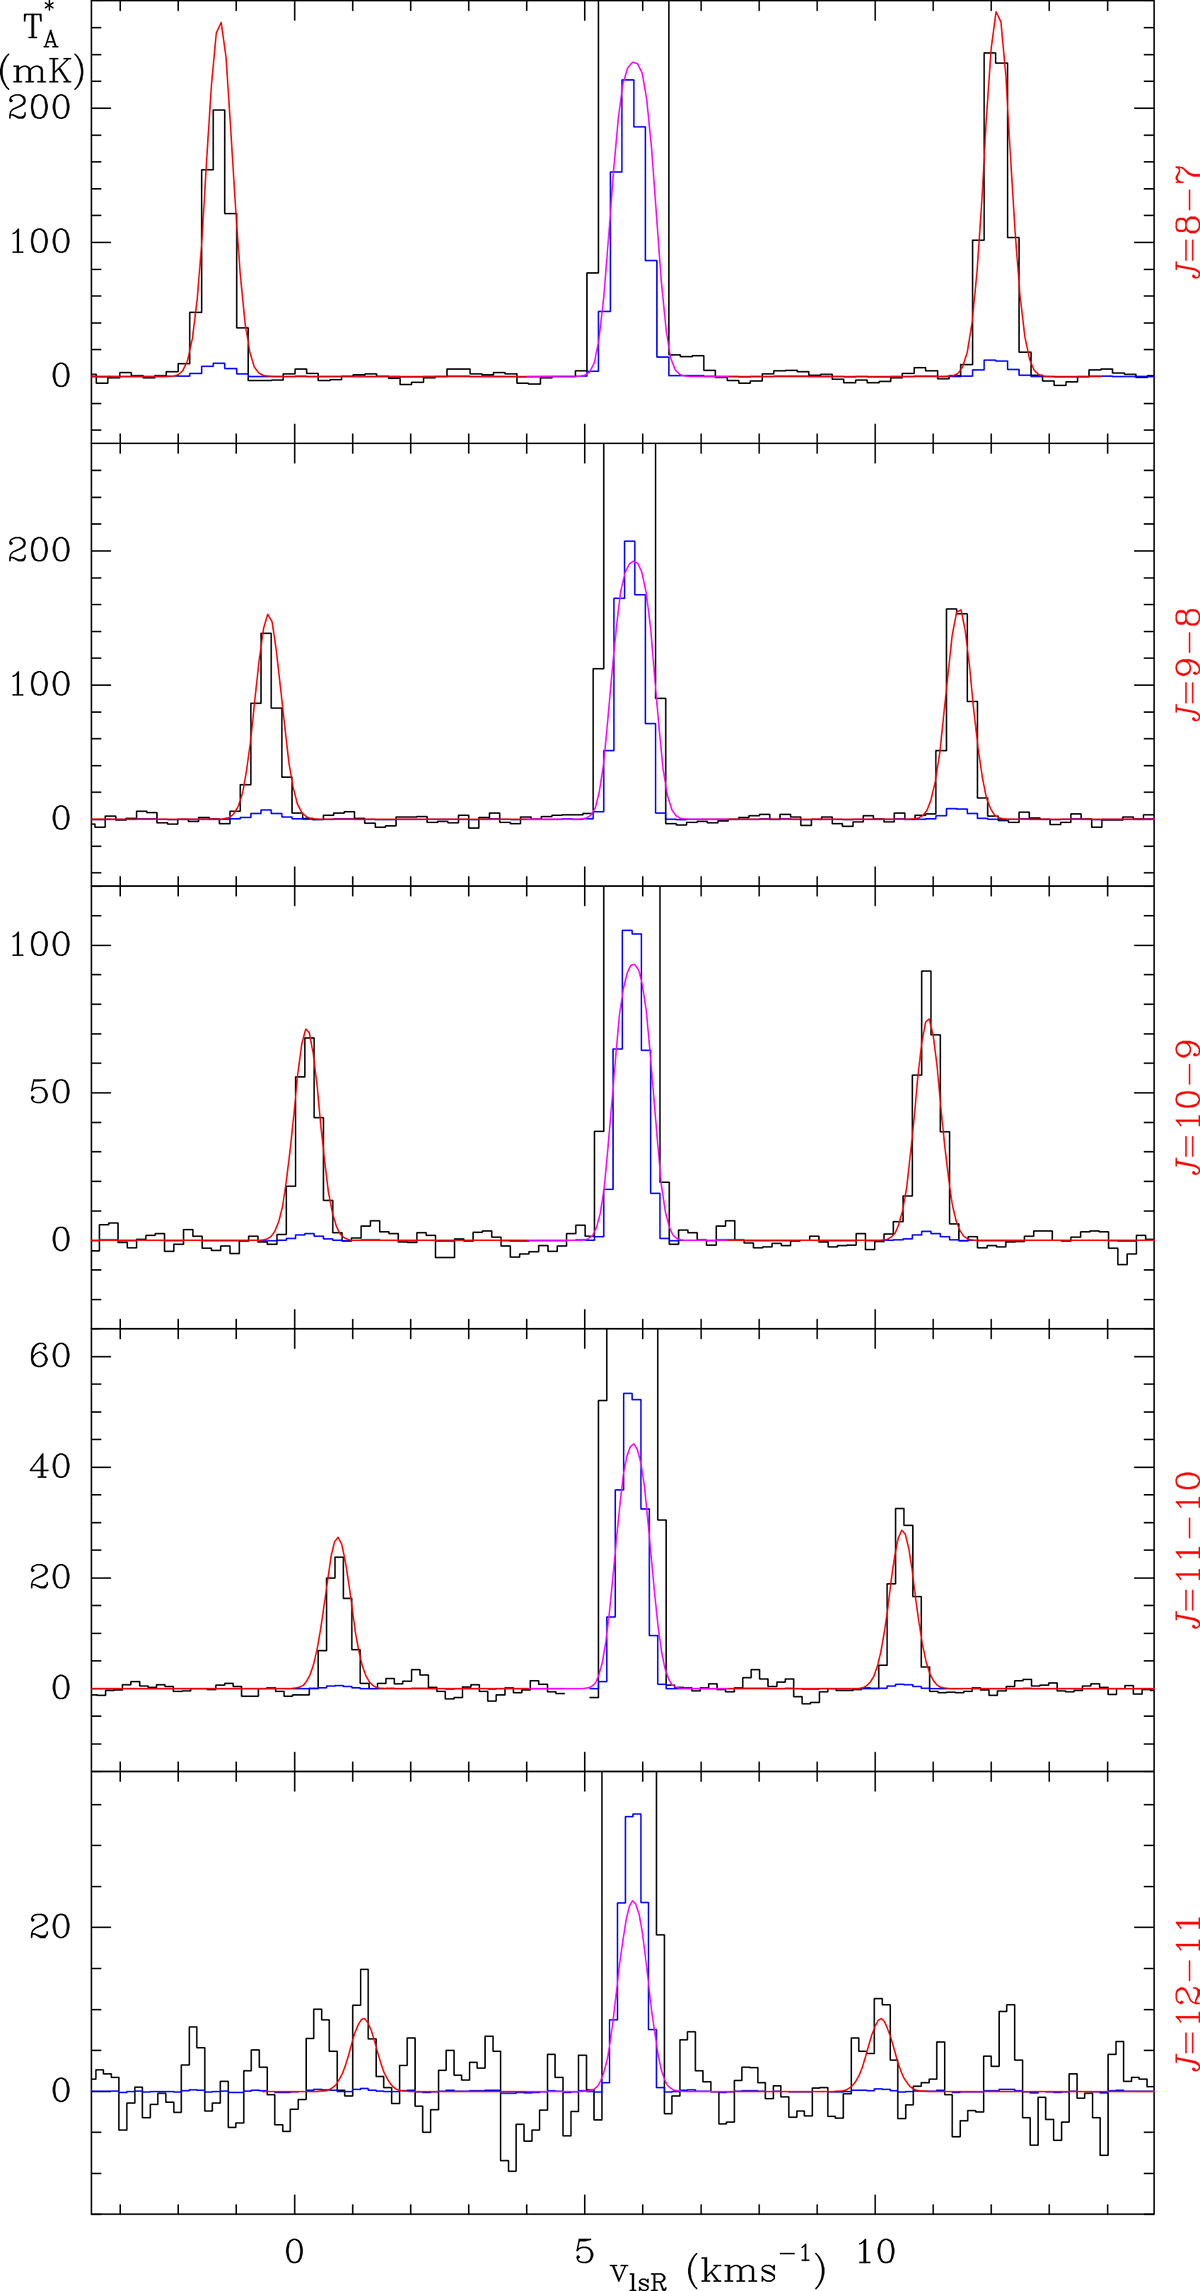
Observed lines of HCCCN towards TMC-1 (CP) at 3 mm (histogram black spectra). The blue histogram spectra show the data divided by a factor of 20, 20, 30, 40, and 40, from top to bottom. The red curves show the synthetic spectra obtained using the LVG approximation (see Sect. 3.1 and Table A.5). The magenta curves show the synthetic spectra divided by the same factors as above.
Current usage metrics show cumulative count of Article Views (full-text article views including HTML views, PDF and ePub downloads, according to the available data) and Abstracts Views on Vision4Press platform.
Data correspond to usage on the plateform after 2015. The current usage metrics is available 48-96 hours after online publication and is updated daily on week days.
Initial download of the metrics may take a while.