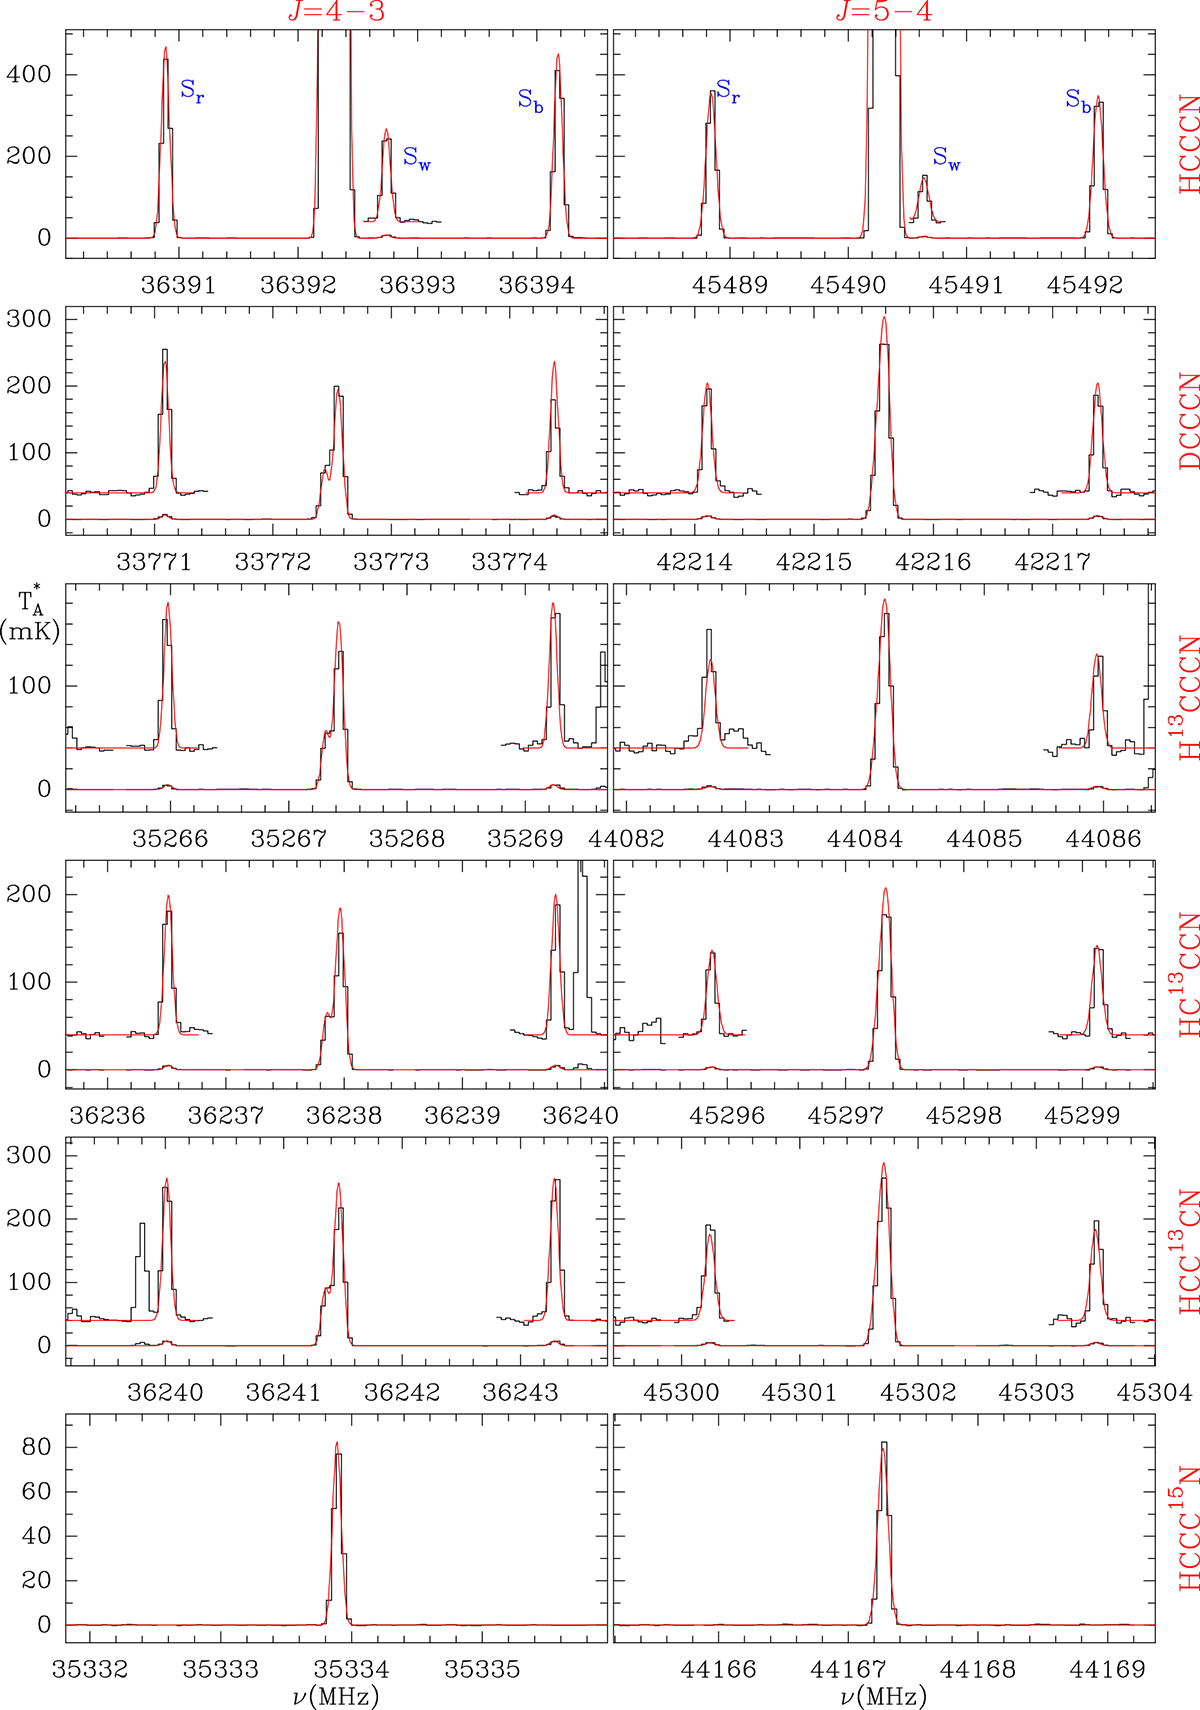
Fig. A.1.
Download original image
Observed lines of HCCCN, DCCCN, H13CCCN, HC13CCN, HCC13CN, and HCCC15N towards TMC-1 (CP) at 7 mm (histogram black spectra). The red curves show the synthetic spectra obtained using the LVG approximation (see Sect. 3.1 and Table A.5). The weak satellite hyperfine lines (Sw for HCCCN and Sr and Sb for the isotopologues) have been offseted and multiplied by a factor of 30. These hyperfine lines correspond to the transitions Fu − Fl = J − J for Sr, Fu − Fl = (J − 1)−J for Sw, and Fu − Fl = (J − 1)−(J − 1) for Sb.
Current usage metrics show cumulative count of Article Views (full-text article views including HTML views, PDF and ePub downloads, according to the available data) and Abstracts Views on Vision4Press platform.
Data correspond to usage on the plateform after 2015. The current usage metrics is available 48-96 hours after online publication and is updated daily on week days.
Initial download of the metrics may take a while.