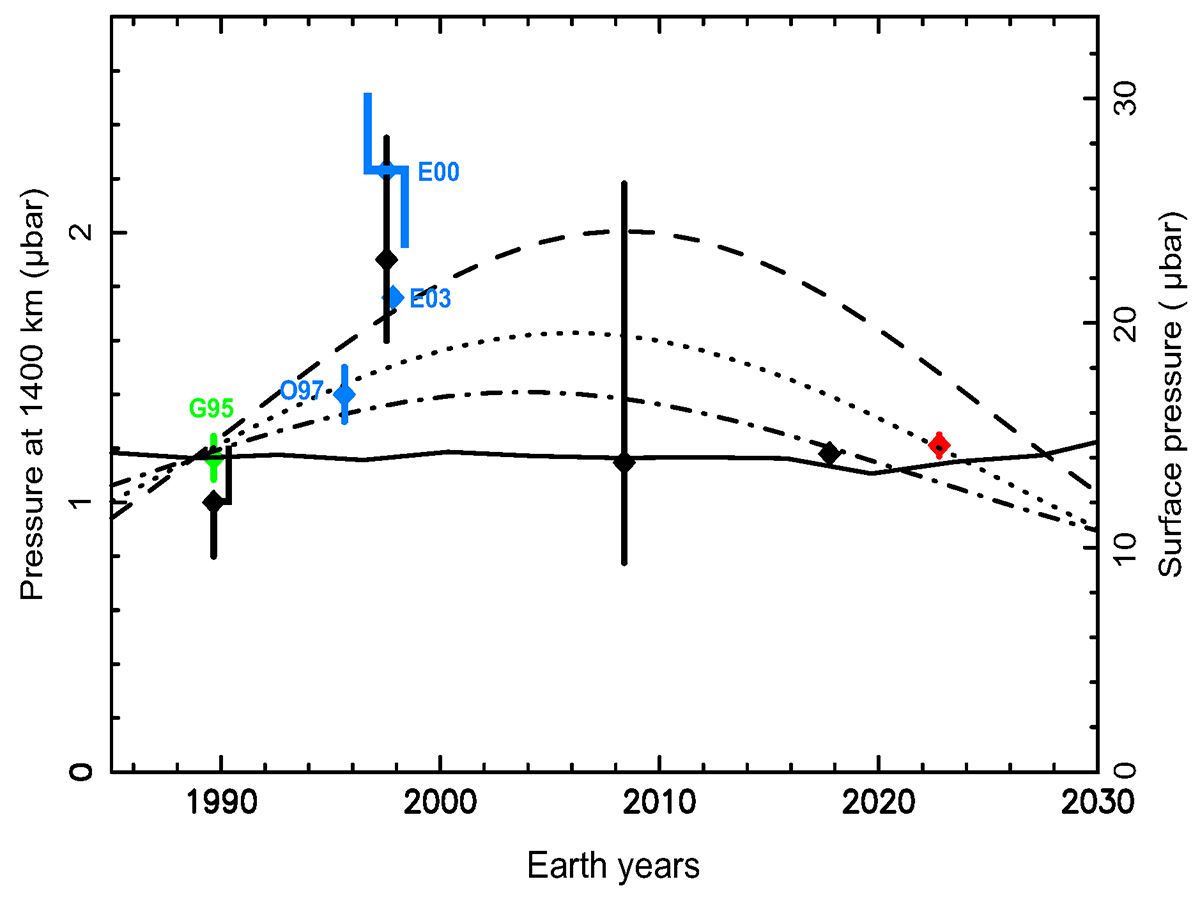
Fig. 3.
Download original image
Comparison of observations with VMT models. The figure shows the atmospheric pressure of Triton obtained from occultation measurements taken between 1989 and 2022 (see dates and values in Table 1). The red point is the result of the 6 October 2022 occultation (this work). It has been obtained using the same method as adopted by MO22 (black points). The green point (G95) is from the V2 RSS occultation of 25 August 1989 (Gurrola 1995). The blue points are O97, ground-based stellar occultation, 14 August 1995 (Olkin et al. 1997); E03, ground-based stellar occultation, 18 July 1997 (Elliot et al. 2000); E00, HST-based stellar occultation, 4 November 1997 (Elliot et al. 2003). It should be noted that MO22 analyzed the RSS data of August 1989 and the occultation data of July 1997 independently of Gurrola (1995) and Elliot et al. (2000), respectively. The vertical axes show the pressures at the reference radius 1400 km (left) and at the surface (right), assuming psurf/p1400 = 12.01 (see text). The lines are examples of VTM simulations by Bertrand et al. (2022). The dash-dotted line shows a model with the southern cap within 90°S–30°S and the northern cap within 45°N–90°N. The dotted line shows a case with the southern cap within 90°S–30°S and the northern cap within 60°N–90°. The dashed line shows another case with the southern cap within 90°S–30°S and no northern cap (volatile-free northern hemisphere). The solid line presents a simulation in which the N2 ice evolved freely over millions of years so that permanent and seasonal polar caps as well as local frost deposits can form self-consistently. In this simulation, the formation of thin seasonal N2 frosts is predicted in the current southern summer in the equatorial regions. None of the simulations fits the data satisfactorily. The dashed line accounts for the pressure increase of 1995–1997, but overestimates the pressures measured in 2017 and 2022. The dotted line marginally explains the increase of 1995–1997 and satisfactorily fits the 2022 measurement, but fails to explain the 2017 point. The dash-dotted line does not fit the increase of 1995–1997, while going through the 2017 point, but fails to explain the 2022 point. The solid line accounts for a basically constant pressure between 1989, 2017, and 2022, as well as the slight increases between 2017 and 2022. However, it is only marginally consistent with the 1995 result, and it does not account for the pressure surge of 1997.
Current usage metrics show cumulative count of Article Views (full-text article views including HTML views, PDF and ePub downloads, according to the available data) and Abstracts Views on Vision4Press platform.
Data correspond to usage on the plateform after 2015. The current usage metrics is available 48-96 hours after online publication and is updated daily on week days.
Initial download of the metrics may take a while.