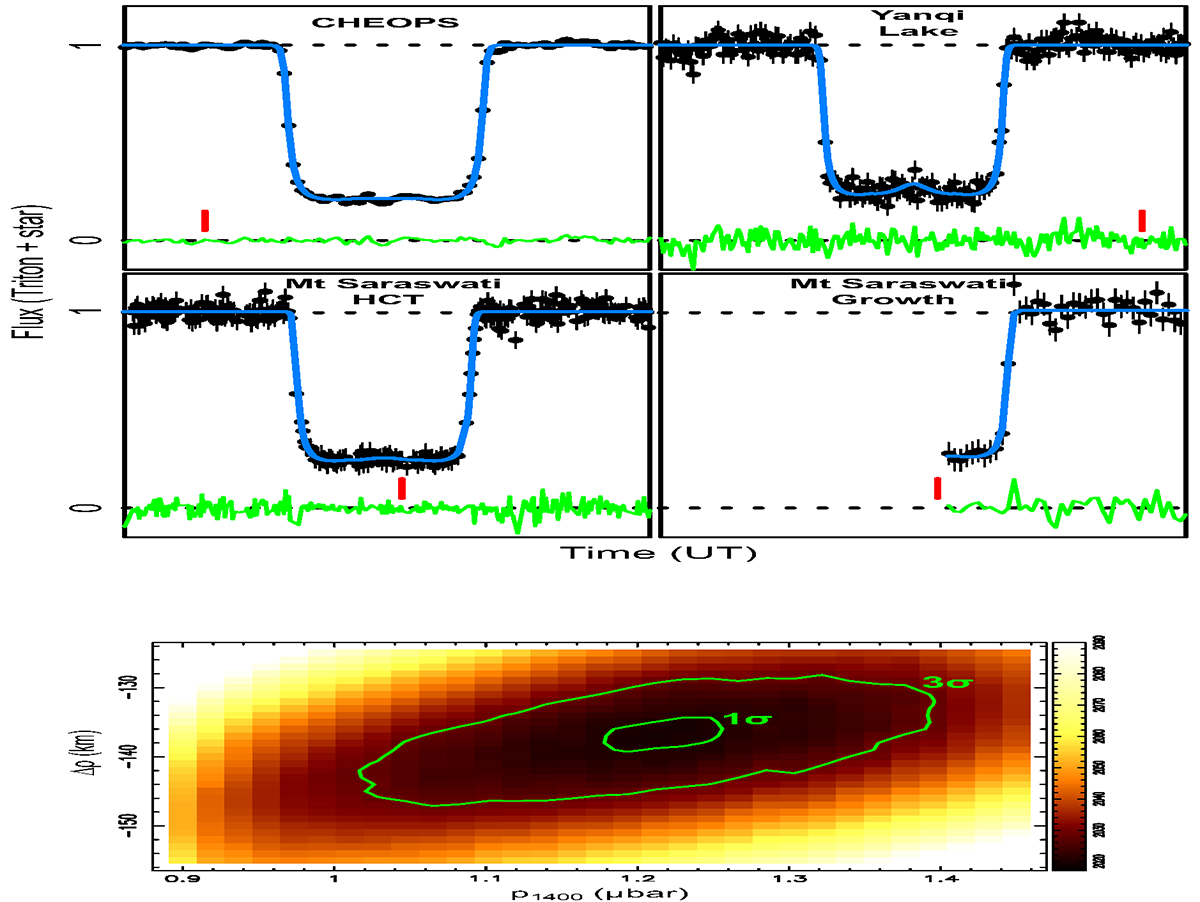
Fig. 2.
Download original image
Simultaneous fits of the data by synthetic light curves. Upper panel: Best fit to the data, shown as blue lines, using a Triton surface pressure of psurf = 14.54 μbar and other parameters provided in Table 1. The residuals (observations minus model) are shown in green. The lower and upper dotted horizontal lines mark the zero flux and the average flux of Triton plus the star, respectively. Each light curve is normalized to the total flux of Triton plus the star and is plotted over a time interval of 6 minutes. The red tick marks indicate 14:41:40 UT. The HCT light curve was binned over five data points (1.05-second time resolution) for a better comparison with the other light curves. We note that a faint central flash is present in the Yanqi Lake light curve. The 1σ error bars are obtained with the PRAIA software, which accounts for the instrumental and photon noises, knowing that the error bars for the CHEOPS data points are dominated by photon noise (see Appendix A). They are not visible here because they are smaller than the plotted dots. Lower panel: χ2 map of the simultaneous fits. The 1σ and 3σ level curves are shown in green.
Current usage metrics show cumulative count of Article Views (full-text article views including HTML views, PDF and ePub downloads, according to the available data) and Abstracts Views on Vision4Press platform.
Data correspond to usage on the plateform after 2015. The current usage metrics is available 48-96 hours after online publication and is updated daily on week days.
Initial download of the metrics may take a while.