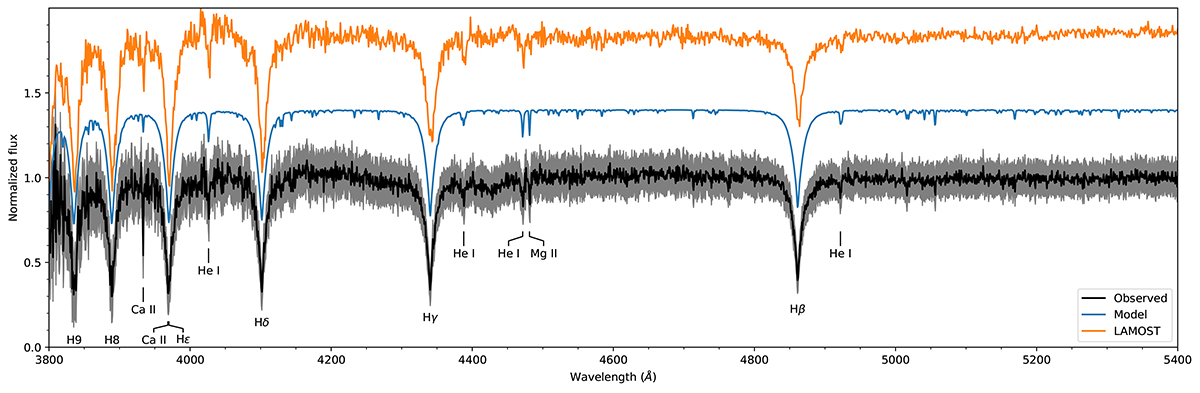
Fig. 2.
Download original image
Normalised optical spectrum of 2MASS J02105640+5845176 (black), as observed with the Intermediate Dispersion Spectrograph at the Isaac Newton Telescope. The best-fitting model spectrum from Munari et al. (2005) is plotted in blue (shifted by +0.4 units vertically) and is characterised by Teff = 14 000 K, log g = 4.5 cgs, [M/H = 0, and vrot sin i = 75 km s−1]. The model spectrum has been convolved with the response of the slit to match the resolution of the observed spectrum. The LAMOST DR7 spectrum from Xiang et al. (2022) is shown in orange (shifted by +0.8 units vertically). Prominent absorption lines are indicated.
Current usage metrics show cumulative count of Article Views (full-text article views including HTML views, PDF and ePub downloads, according to the available data) and Abstracts Views on Vision4Press platform.
Data correspond to usage on the plateform after 2015. The current usage metrics is available 48-96 hours after online publication and is updated daily on week days.
Initial download of the metrics may take a while.