Fig. 3.
Download original image
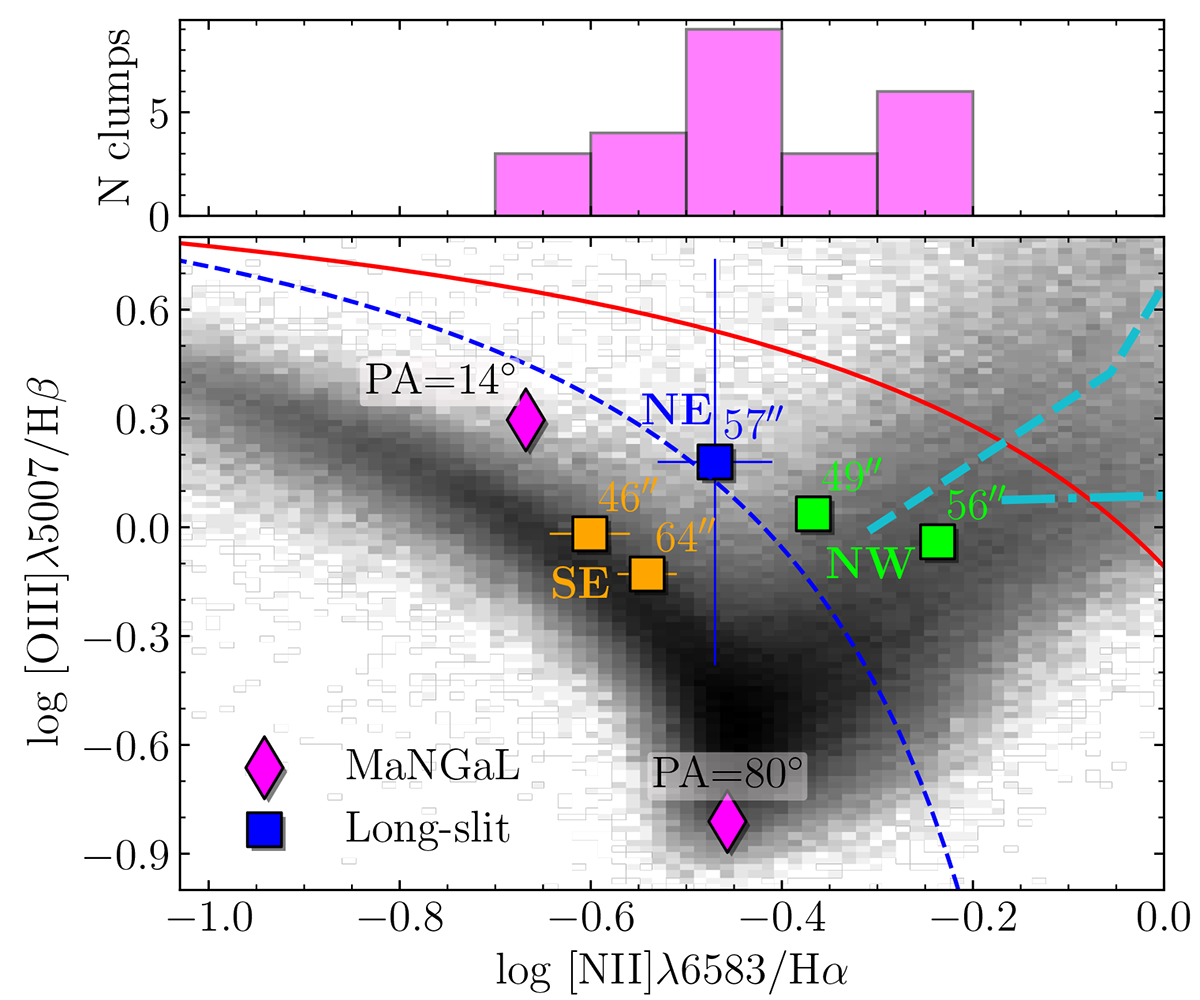
Emission lines in the ring of NGC 1211: the distribution of 25 emission-line clumps over the parameter N2 = log([N II]λ6583/Hα) and the BPT diagram for the ring clumps, from the long-slit spectroscopy (squares) and from the MaNGaL imaging (diamonds). On the BPT diagram, the separating lines are from Kewley et al. (2001 solid red line) and Kauffmann et al. (2003 dashed blue line); the shock-excitation models from Allen et al. (2008) are shown as dashed and dashed-dotted blue lines for vshock = 100 km s−1 and 150 km s−1. Our long-slit data are marked with their distances from the center (blue means the northeast, orange means the southeast, and green means the northwest). For the MaNGaL data along the ring, the clump position angles with respect to the center are given. The gray background distribution corresponds to emission-line measurements from the Reference Catalog of Spectral Energy Distributions (RCSED) (http://rcsed.sai.msu.ru, Chilingarian et al. 2017).
Current usage metrics show cumulative count of Article Views (full-text article views including HTML views, PDF and ePub downloads, according to the available data) and Abstracts Views on Vision4Press platform.
Data correspond to usage on the plateform after 2015. The current usage metrics is available 48-96 hours after online publication and is updated daily on week days.
Initial download of the metrics may take a while.