Fig. 3
Download original image
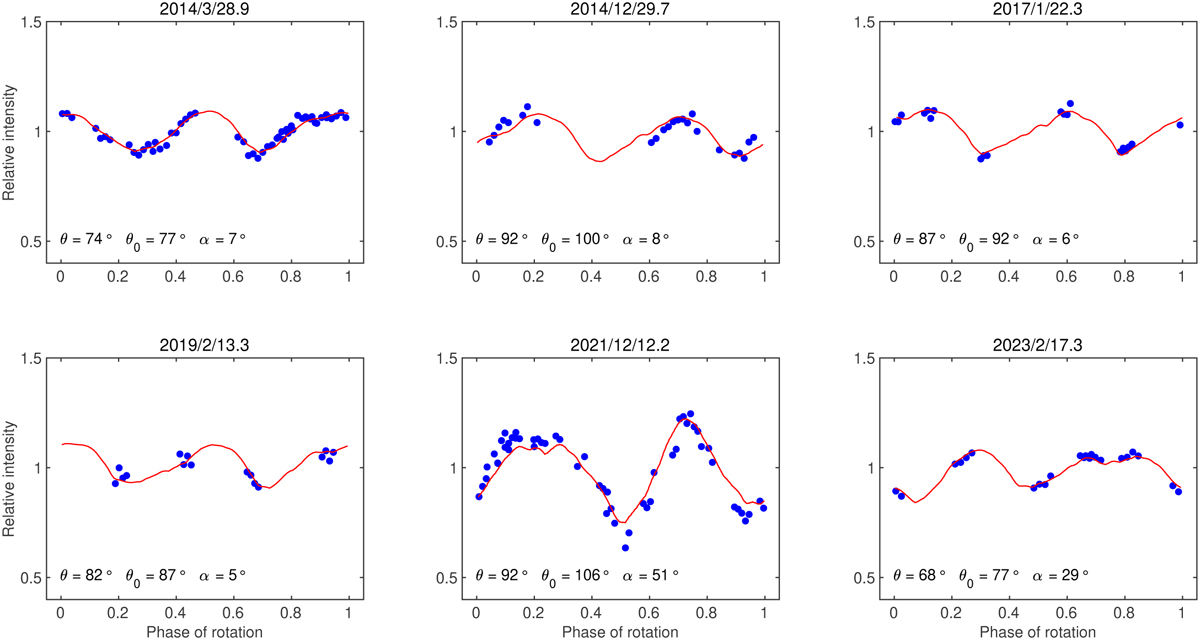
Example light curves of (1862) Apollo. The epoch of observation is shown by the label at the top of each panel. The blue points are the observed data, and the red curve is our best model including YORP. The geometry of the observation is described by the aspect angle θ, the solar aspect angle θ0, and the solar phase angle α.
Current usage metrics show cumulative count of Article Views (full-text article views including HTML views, PDF and ePub downloads, according to the available data) and Abstracts Views on Vision4Press platform.
Data correspond to usage on the plateform after 2015. The current usage metrics is available 48-96 hours after online publication and is updated daily on week days.
Initial download of the metrics may take a while.