Fig. 16
Download original image
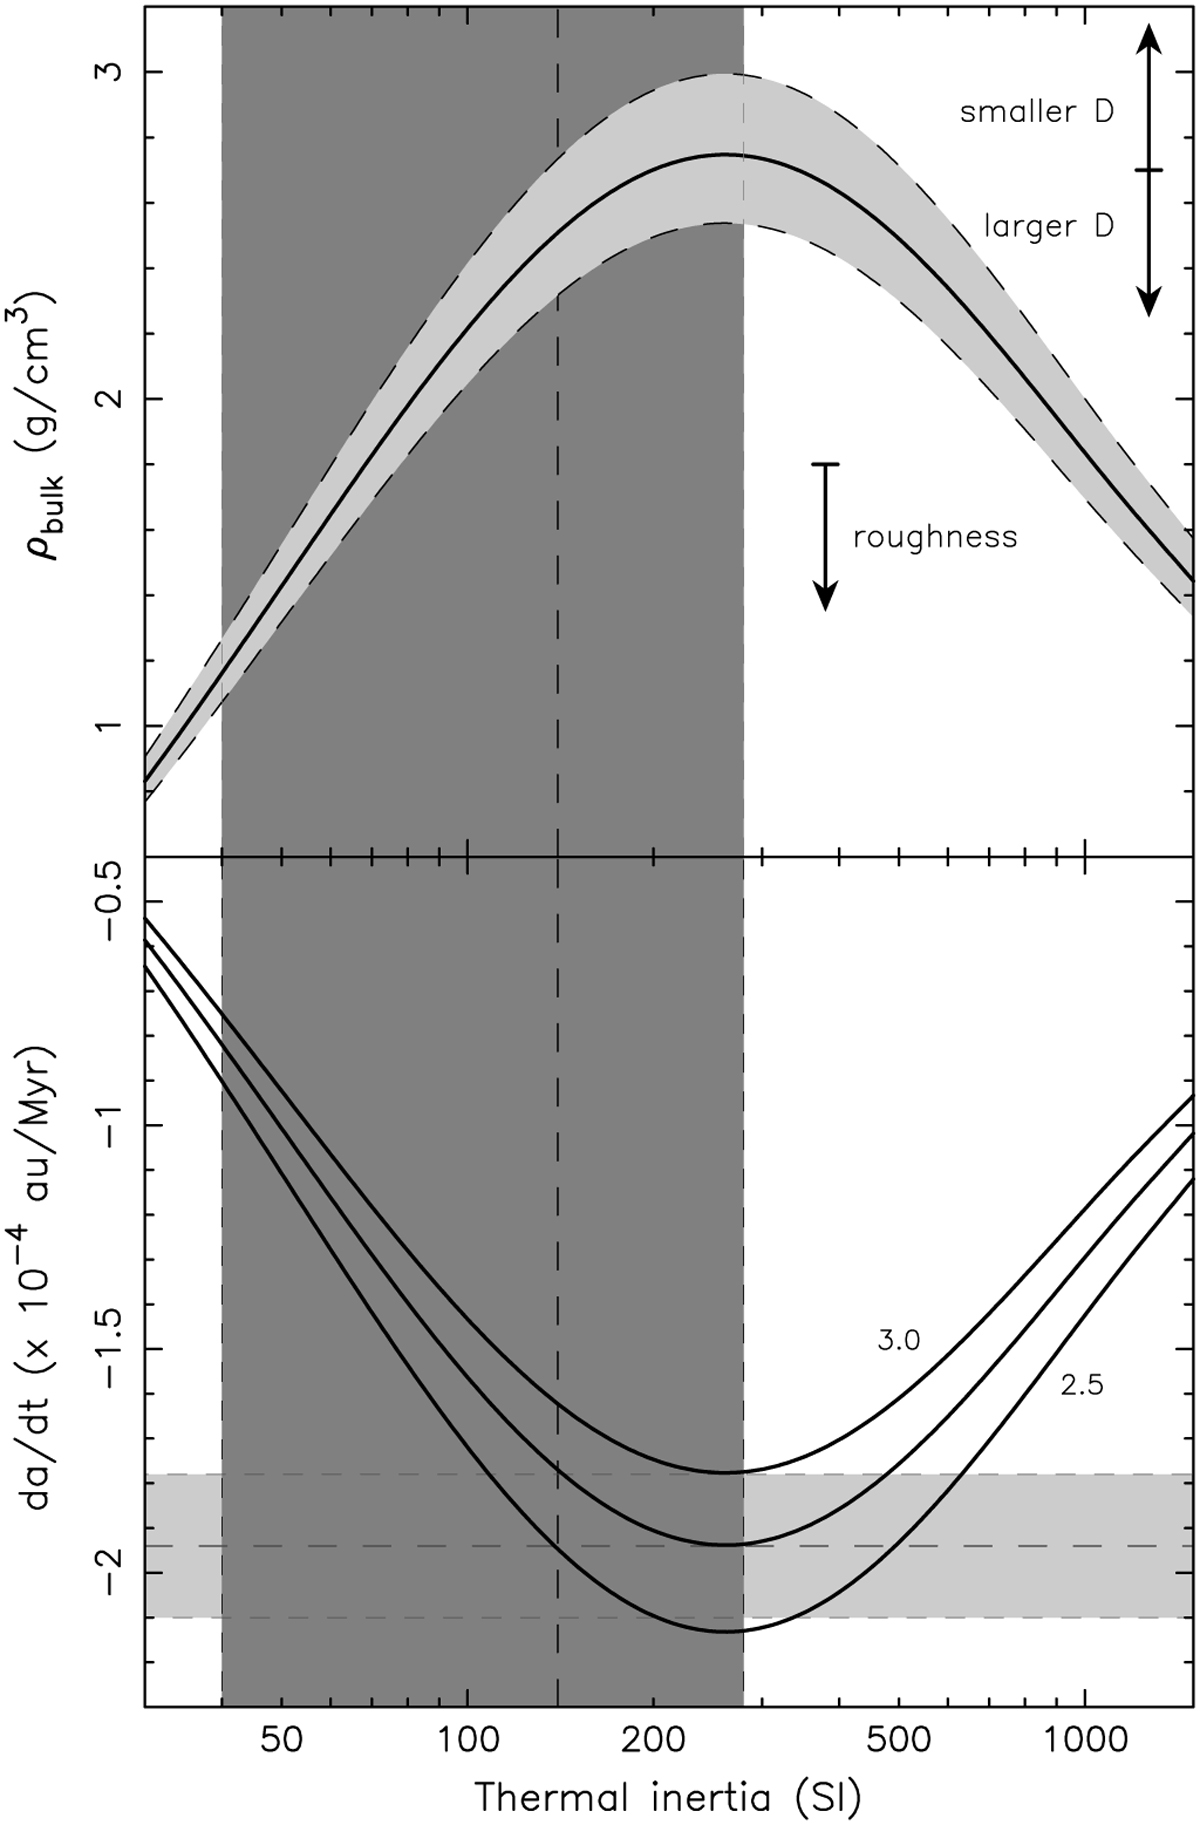
Predicted values of the Yarkovsky effect and density for asteroid (1862) Apollo. Bottom panel: Predicted semimajor axis drift da/dt (ordinate) due to the Yarkovsky effect from our model for three different values of the bulk density (2.5, 2.75, and 3 g cm−3; see the labels and the middle curve for 2.75 g cm−3) are shown by solid curves. The abscissa is the surface thermal inertia in SI units (J m−2 s−0.5 K−1). We assumed the rotation state and shape model from the light-curve inversion in Sect. 2.1, and an effective size of 1.55 km. The grayscale horizontal region shows the value −(1.94 ± 0.16) × 10−4 au My−1 from the orbit determination. The grayscale vertical region shows the range of the best-fit surface thermal inertia value ![]() (see Rozitis & Green 2012). Top panel: Model-predicted bulk density to match the observed value of the semimajor axis drift shown by the grayscale region. The solid line in the middle shows the exact correspondence surrounded by a map of the sigma interval of the Yarkovsky drift. A nominal effective size of 1.55 km is used. If this value were higher or lower, the density solution would shift in the direction indicated by the arrows (preserving the ρb D value). The analysis of ten different shape models of (1862) Apollo reveals a variation of ±12% about the median value used in the figure. Effects of small-scale surface roughness, if important, would shift the solution toward a lower value by typically 10–30% (see Rozitis & Green 2012).
(see Rozitis & Green 2012). Top panel: Model-predicted bulk density to match the observed value of the semimajor axis drift shown by the grayscale region. The solid line in the middle shows the exact correspondence surrounded by a map of the sigma interval of the Yarkovsky drift. A nominal effective size of 1.55 km is used. If this value were higher or lower, the density solution would shift in the direction indicated by the arrows (preserving the ρb D value). The analysis of ten different shape models of (1862) Apollo reveals a variation of ±12% about the median value used in the figure. Effects of small-scale surface roughness, if important, would shift the solution toward a lower value by typically 10–30% (see Rozitis & Green 2012).
Current usage metrics show cumulative count of Article Views (full-text article views including HTML views, PDF and ePub downloads, according to the available data) and Abstracts Views on Vision4Press platform.
Data correspond to usage on the plateform after 2015. The current usage metrics is available 48-96 hours after online publication and is updated daily on week days.
Initial download of the metrics may take a while.