Open Access
Fig. 13
Download original image
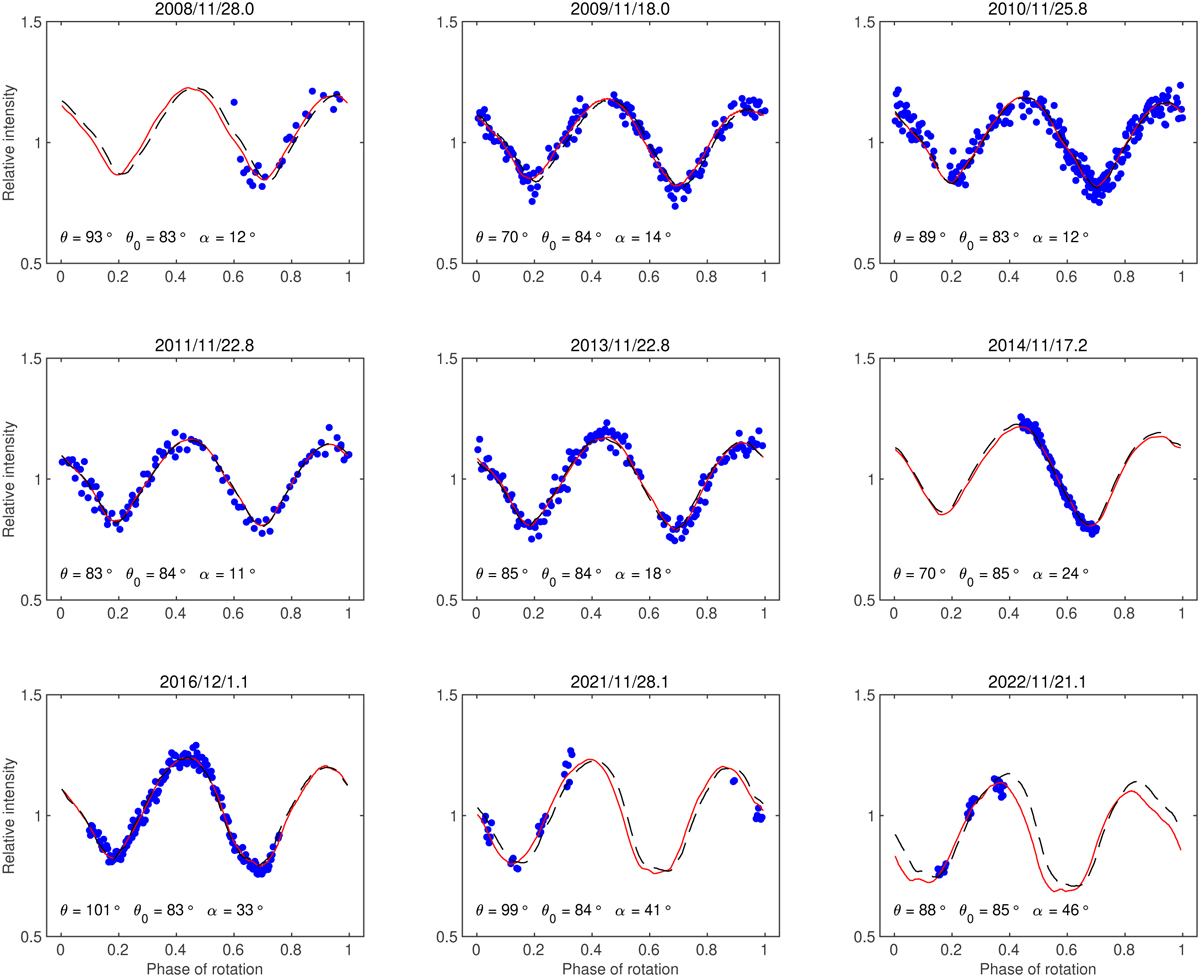
Example light curves of (138852) 2000 WN10. The blue points show the observed data, the red curve shows our best model with YORP, and the dashed curve shows the best model without YORP.
Current usage metrics show cumulative count of Article Views (full-text article views including HTML views, PDF and ePub downloads, according to the available data) and Abstracts Views on Vision4Press platform.
Data correspond to usage on the plateform after 2015. The current usage metrics is available 48-96 hours after online publication and is updated daily on week days.
Initial download of the metrics may take a while.