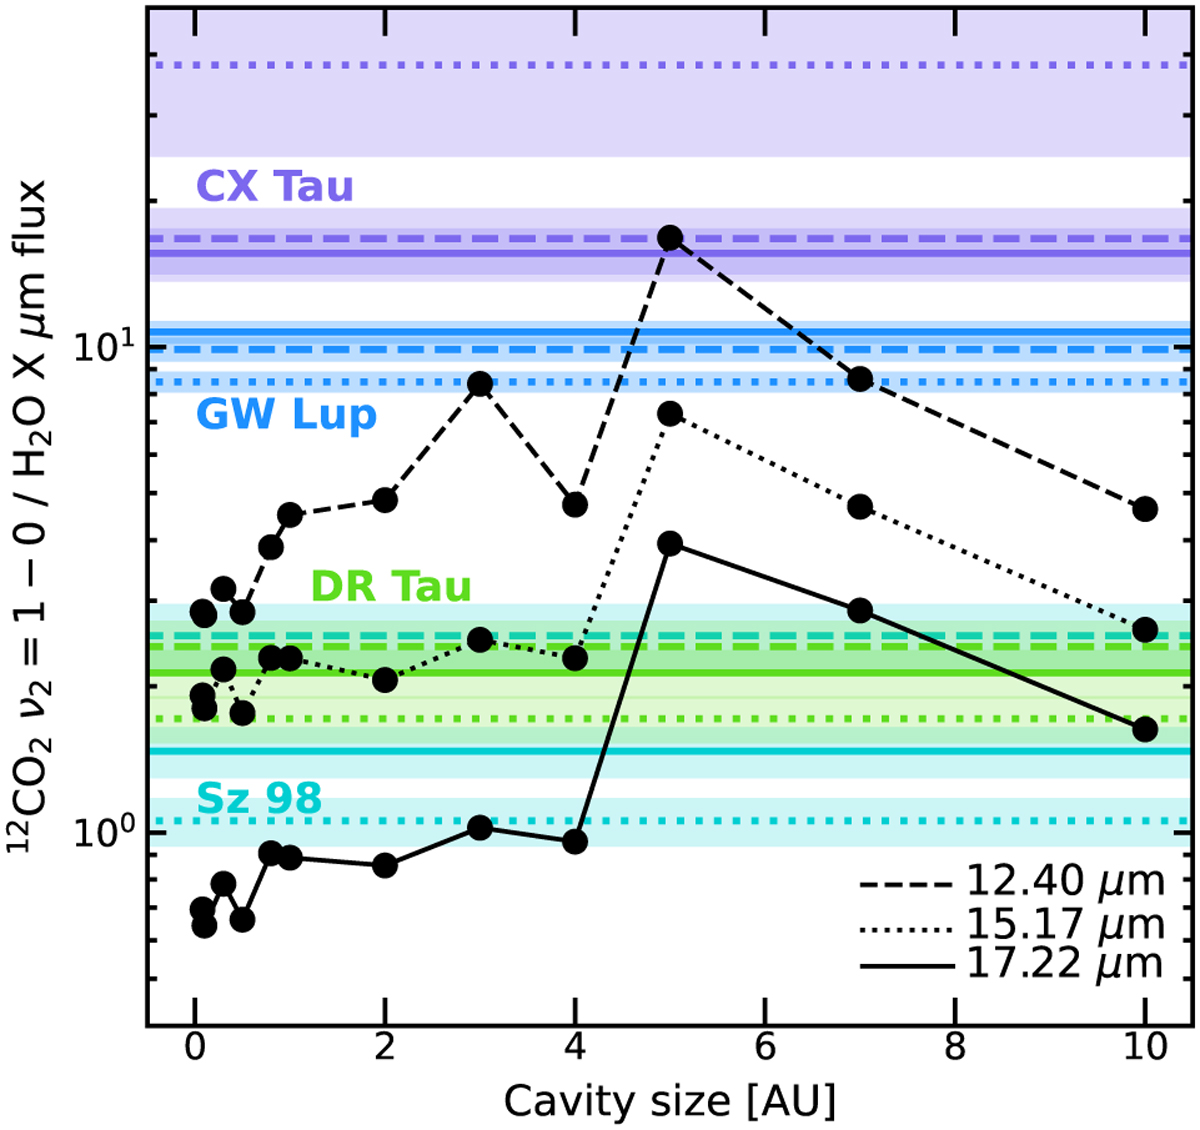
Fig. 8
Download original image
Ratio of the 12CO2 Q-branch flux and the fluxes of the 12.40, 15.17, and 17.22 µm H2O line complexes from our fiducial grid of models, plotted as a function of cavity size, shown with dashed, dotted and solid black lines, respectively. Vertical colored lines, with bars indicating the uncertainty, indicate the same CO2 /H2O flux ratios calculated for JWST-MIRI observations of GW Lup (Grant et al. 2023), Sz 98 (Gasman et al. 2023), DR Tau (Temmink et al., in prep.), and CX Tau (Vlasblom et al., in prep.), all taken as a part of the MINDS program.
Current usage metrics show cumulative count of Article Views (full-text article views including HTML views, PDF and ePub downloads, according to the available data) and Abstracts Views on Vision4Press platform.
Data correspond to usage on the plateform after 2015. The current usage metrics is available 48-96 hours after online publication and is updated daily on week days.
Initial download of the metrics may take a while.