Fig. B.6
Download original image
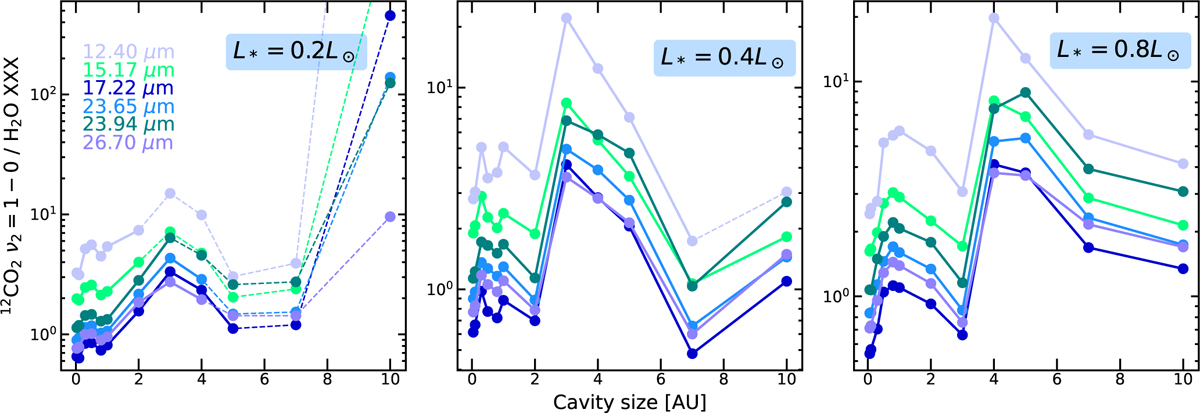
Ratio of the 12CO2 Q-branch flux and the fluxes of several H2O line complexes, plotted as a function of cavity size for the models with input spectra with L* = 0.2, 0.4, 0.8 L⊙. Note the different vertical scales of these panels. Properties of these lines can be found in Table 2. Data points are connected by dashed lines if the line flux drops below 10−15 erg s−1 cm−2, indicating that the lines will become more difficult to observe.
Current usage metrics show cumulative count of Article Views (full-text article views including HTML views, PDF and ePub downloads, according to the available data) and Abstracts Views on Vision4Press platform.
Data correspond to usage on the plateform after 2015. The current usage metrics is available 48-96 hours after online publication and is updated daily on week days.
Initial download of the metrics may take a while.