Fig. A.3
Download original image
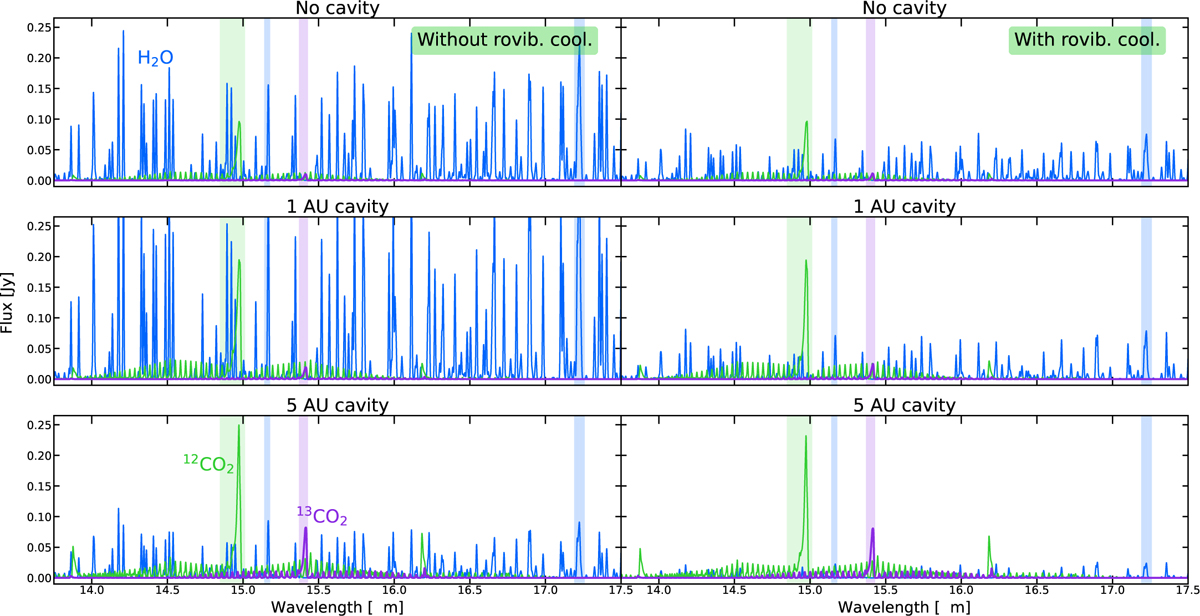
Generated H2O, 12CO2, and 13CO2 spectra for the fiducial grid without H2O ro-vibrational cooling (left column) and the grid with H2O ro-vibrational cooling (right column). The spectra are shown for the models with no cavity (top row), a 1 AU cavity (middle row), and a 5 AU cavity (bottom row). The vertical colored bars indicate the integration ranges for the H2O 15.17 and 17.22 µm flux (blue), as well as the 12CO2 and 13CO2 Q-branches (green and purple respectively).
Current usage metrics show cumulative count of Article Views (full-text article views including HTML views, PDF and ePub downloads, according to the available data) and Abstracts Views on Vision4Press platform.
Data correspond to usage on the plateform after 2015. The current usage metrics is available 48-96 hours after online publication and is updated daily on week days.
Initial download of the metrics may take a while.