Fig. A.1
Download original image
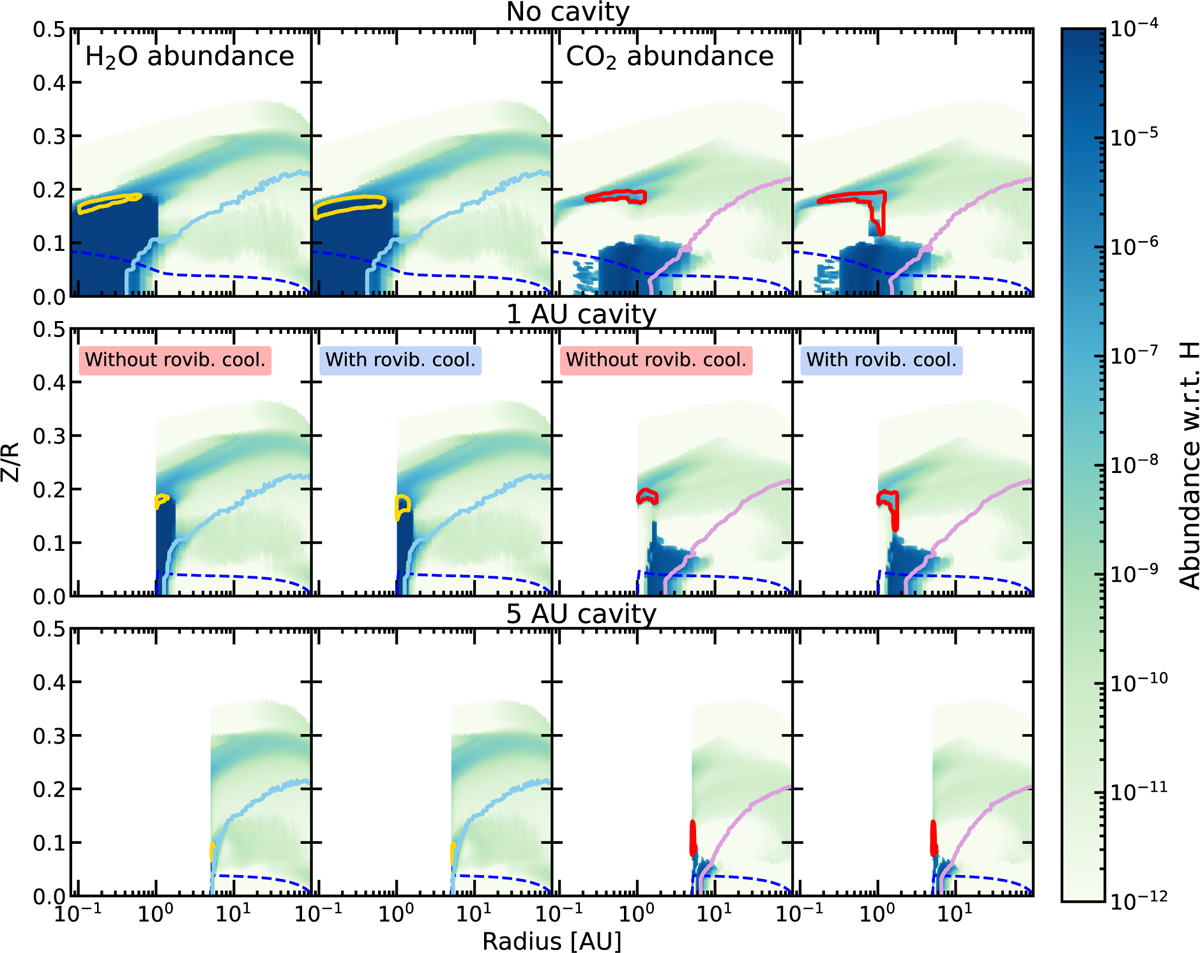
Abundance maps of H2O (first and second columns) and CO2 (third and fourth columns) for the models with no cavity (top row), a 1 AU cavity (middle row), and a 5 AU cavity (bottom row) for the fiducial grid without H2O ro-vibrational cooling (first and third columns) and the grid with H2O ro-vibrational cooling (second and fourth columns). The H2O and CO2 snowlines (defined as ngas/nice = 1) are indicated with solid light blue and pink lines, respectively. The dashed, dark blue line shows the dust τ = 1 surface at 15 µm. The yellow contours indicate the region in which 90% of the H2O 113,9 − 100,10 line emission at 17.22 µm (Eup = 2438 K) originates. The red contours indicate the origin of 90% of the CO2 0110 − 0000 Q(20) line emission (Eup = 1196 K).
Current usage metrics show cumulative count of Article Views (full-text article views including HTML views, PDF and ePub downloads, according to the available data) and Abstracts Views on Vision4Press platform.
Data correspond to usage on the plateform after 2015. The current usage metrics is available 48-96 hours after online publication and is updated daily on week days.
Initial download of the metrics may take a while.