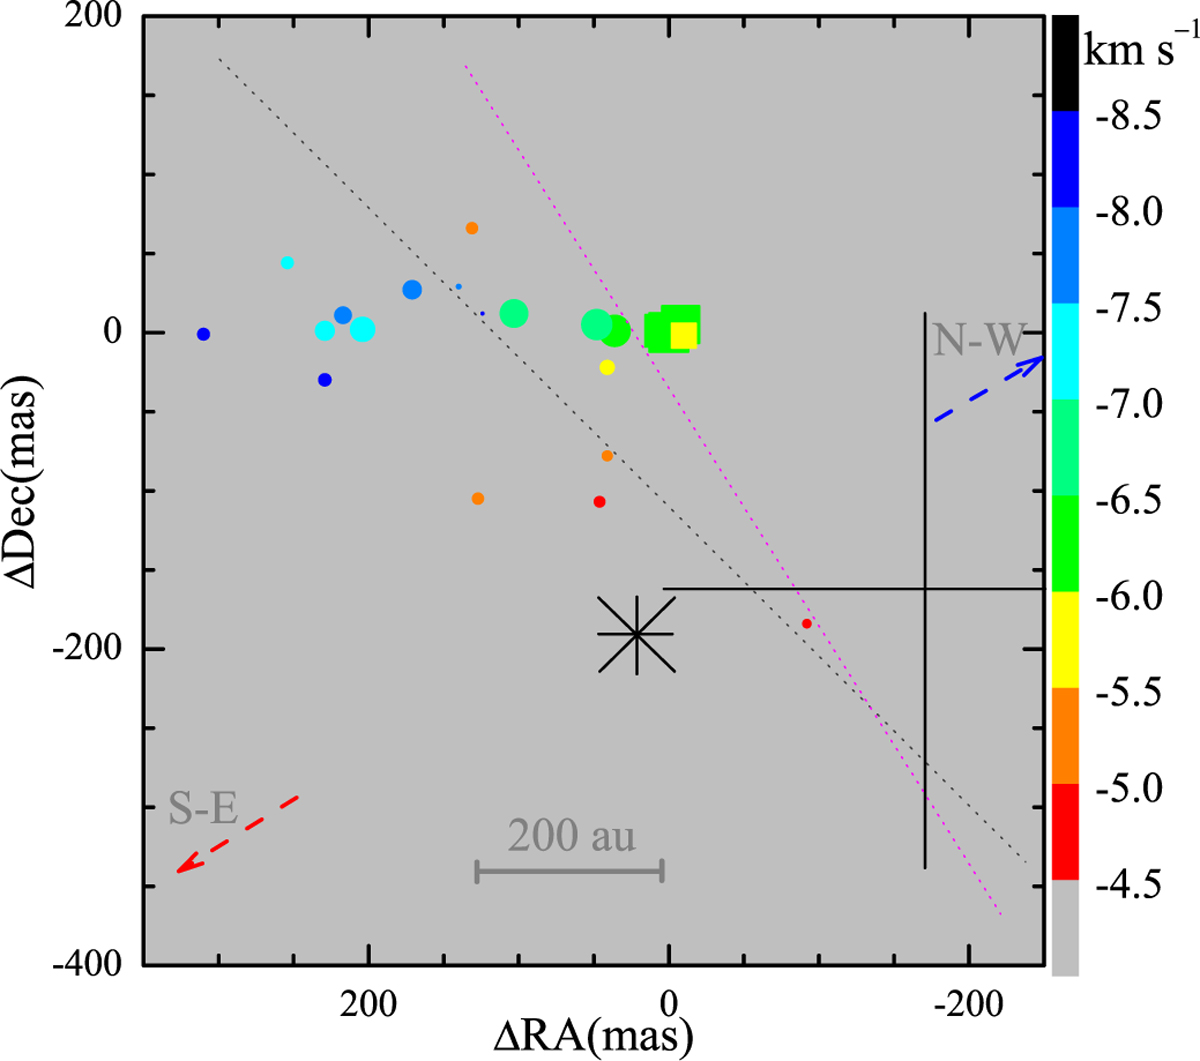
Fig. 8
Download original image
Map of the maser spots in IRAS 20216+4104 obtained on 2012 March 4 with VLA-C (Hu et al. 2016). The colour and size of symbols correspond to the velocity scale, as shown in the wedge and the logarithm of intensity, respectively. The circles and squares denote the maser spots whose emission synchronously varies with the NIR continuum of the SE and NW lobes (Massi et al. 2023), respectively. The dashed arrows show the direction of the large-scale (~10″) outflow (Cesaroni et al. 2013). The asterisk marks the nominal position of the protostar derived from the model fit to the water masers (Moscadelli et al. 2011). The cross marks the position of the 230 GHz continuum emission peak and its size corresponds to the uncertainty (Cesaroni et al. 2014). The dotted black line marks the direction of the disc plane (Cesaroni et al. 2005). The dotted magenta line is orthogonal to the axis of large-scale jet or outflow and divides the maser spot distribution into two parts, which show anti-correlated variability.
Current usage metrics show cumulative count of Article Views (full-text article views including HTML views, PDF and ePub downloads, according to the available data) and Abstracts Views on Vision4Press platform.
Data correspond to usage on the plateform after 2015. The current usage metrics is available 48-96 hours after online publication and is updated daily on week days.
Initial download of the metrics may take a while.