Fig. 3
Download original image
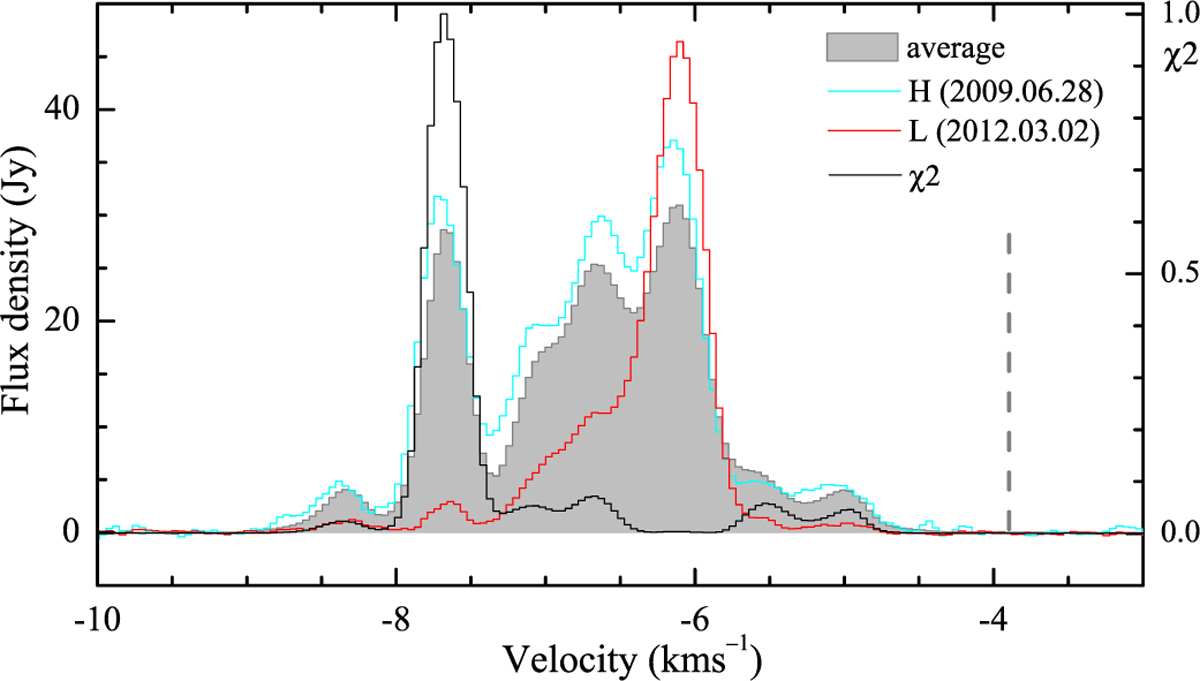
Comparison of 6.7 GHz maser spectra obtained with the Torun telescope. The average spectrum is for 669 observations from MJD 55006 to 60208. The spectra marked by the cyan and red lines are typical for high (H) and low (L) activity states, respectively. The black line represents the normalized χ2 values as a measure of variability. The dashed vertical line indicates the systemic velocity (Cesaroni et al. 2005).
Current usage metrics show cumulative count of Article Views (full-text article views including HTML views, PDF and ePub downloads, according to the available data) and Abstracts Views on Vision4Press platform.
Data correspond to usage on the plateform after 2015. The current usage metrics is available 48-96 hours after online publication and is updated daily on week days.
Initial download of the metrics may take a while.