Fig. 1
Download original image
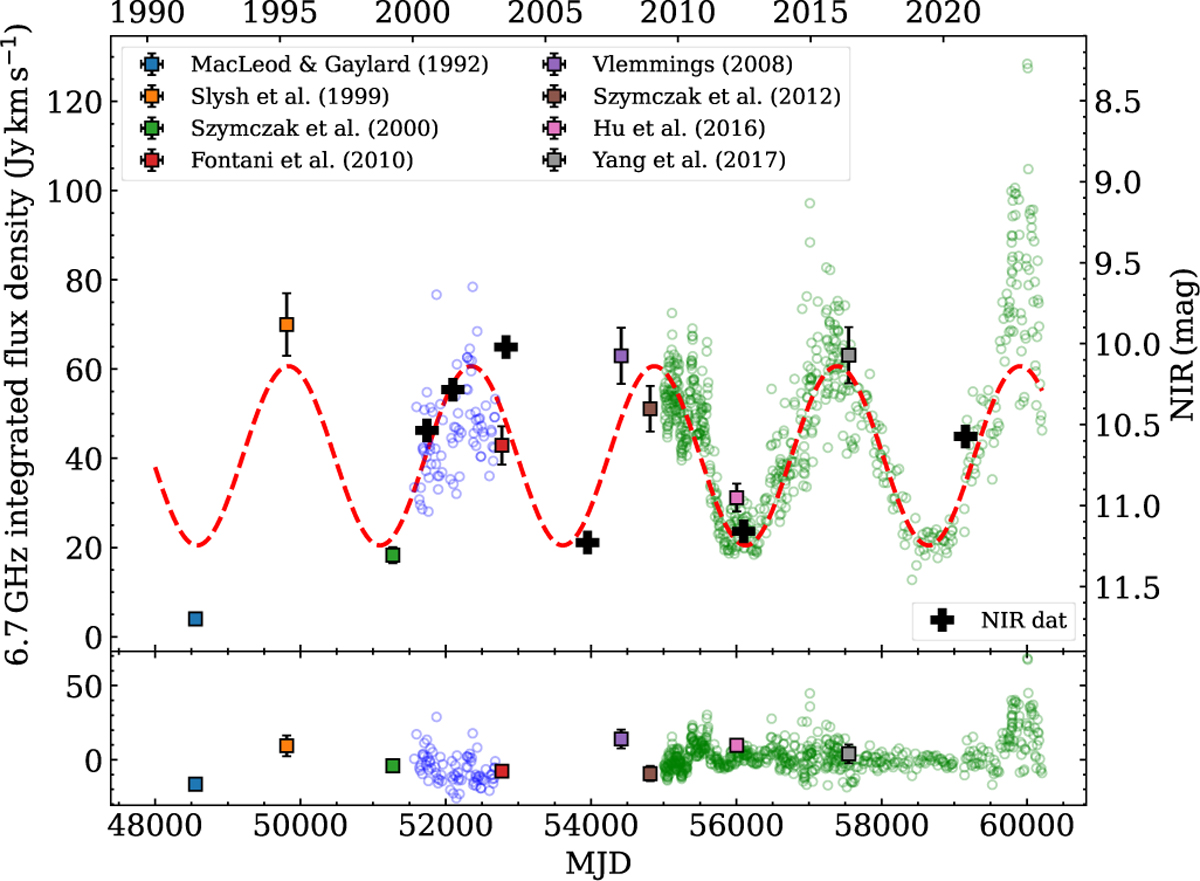
Time series of the velocity integrated 6.7 GHz maser flux density in IRAS 20216+4104 with the sinusoidal fitted dashed red line (top). The open circles denote the data from the HartRAO (in violet) and Torun (in green) radio telescopes. The squares mark the data from the literature (Table A.1) as indicated in the legend. Residuals from subtracting the sinusoidal fitting from the observational data are shown in the bottom panel. The black crosses mark the NIR continuum emission of the south-eastern outflow cavity (Massi et al. 2023, polygons S1 and S2 in their Fig. 2).
Current usage metrics show cumulative count of Article Views (full-text article views including HTML views, PDF and ePub downloads, according to the available data) and Abstracts Views on Vision4Press platform.
Data correspond to usage on the plateform after 2015. The current usage metrics is available 48-96 hours after online publication and is updated daily on week days.
Initial download of the metrics may take a while.