Fig. 7
Download original image
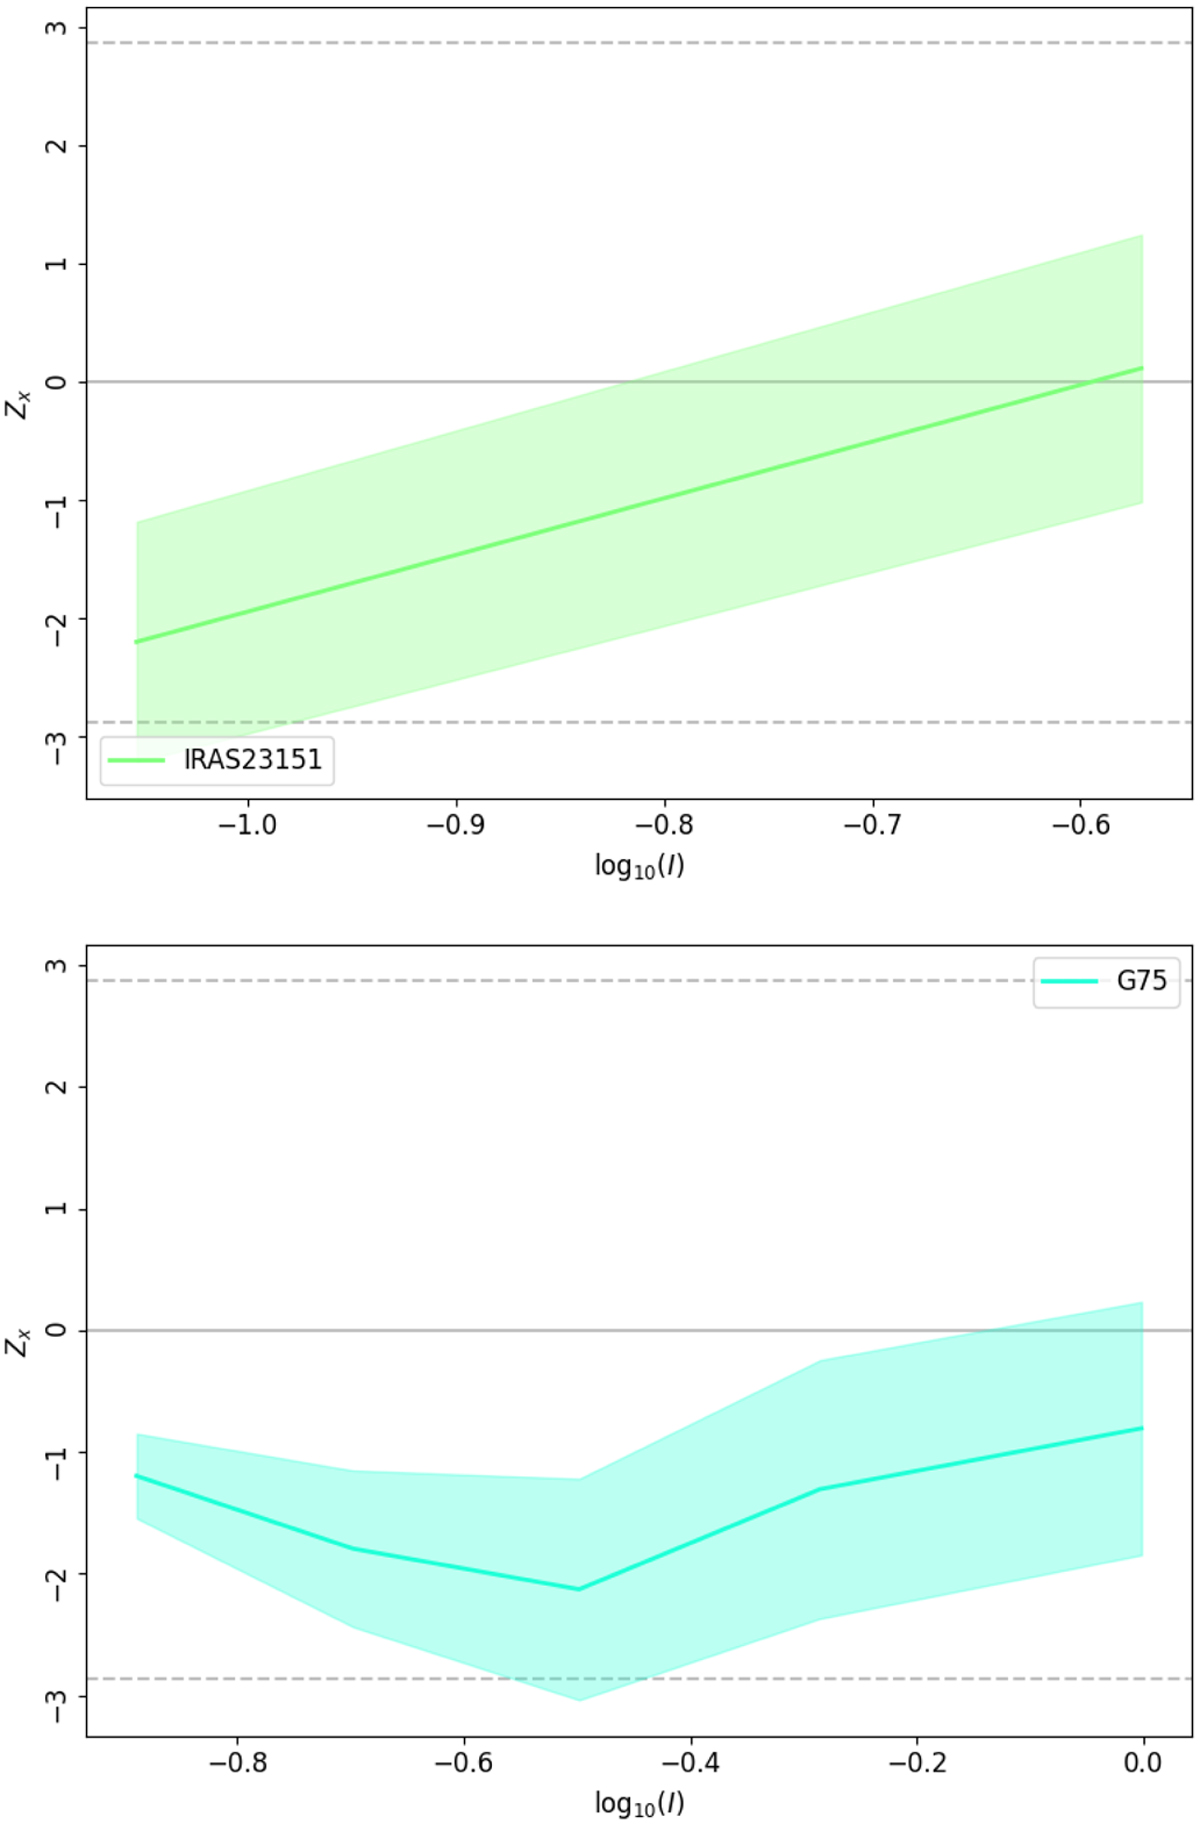
Histogram of oriented gradient (HRO) plots for two example regions, IRAS 23151 (top) and G75.78 (bottom). The X-axis shows the Stokes I intensity, and the Y-axis the projected Rayleigh statistic Zx (also known as V). Positive Zx values correspond to largely parallel orientation and negative Zx to largely perpendicular orientations between magnetic field and gas column density. The dashed lines at ~12.871 correspond to 3σ significance in circular statistics.
Current usage metrics show cumulative count of Article Views (full-text article views including HTML views, PDF and ePub downloads, according to the available data) and Abstracts Views on Vision4Press platform.
Data correspond to usage on the plateform after 2015. The current usage metrics is available 48-96 hours after online publication and is updated daily on week days.
Initial download of the metrics may take a while.