Open Access
Fig. 4
Download original image
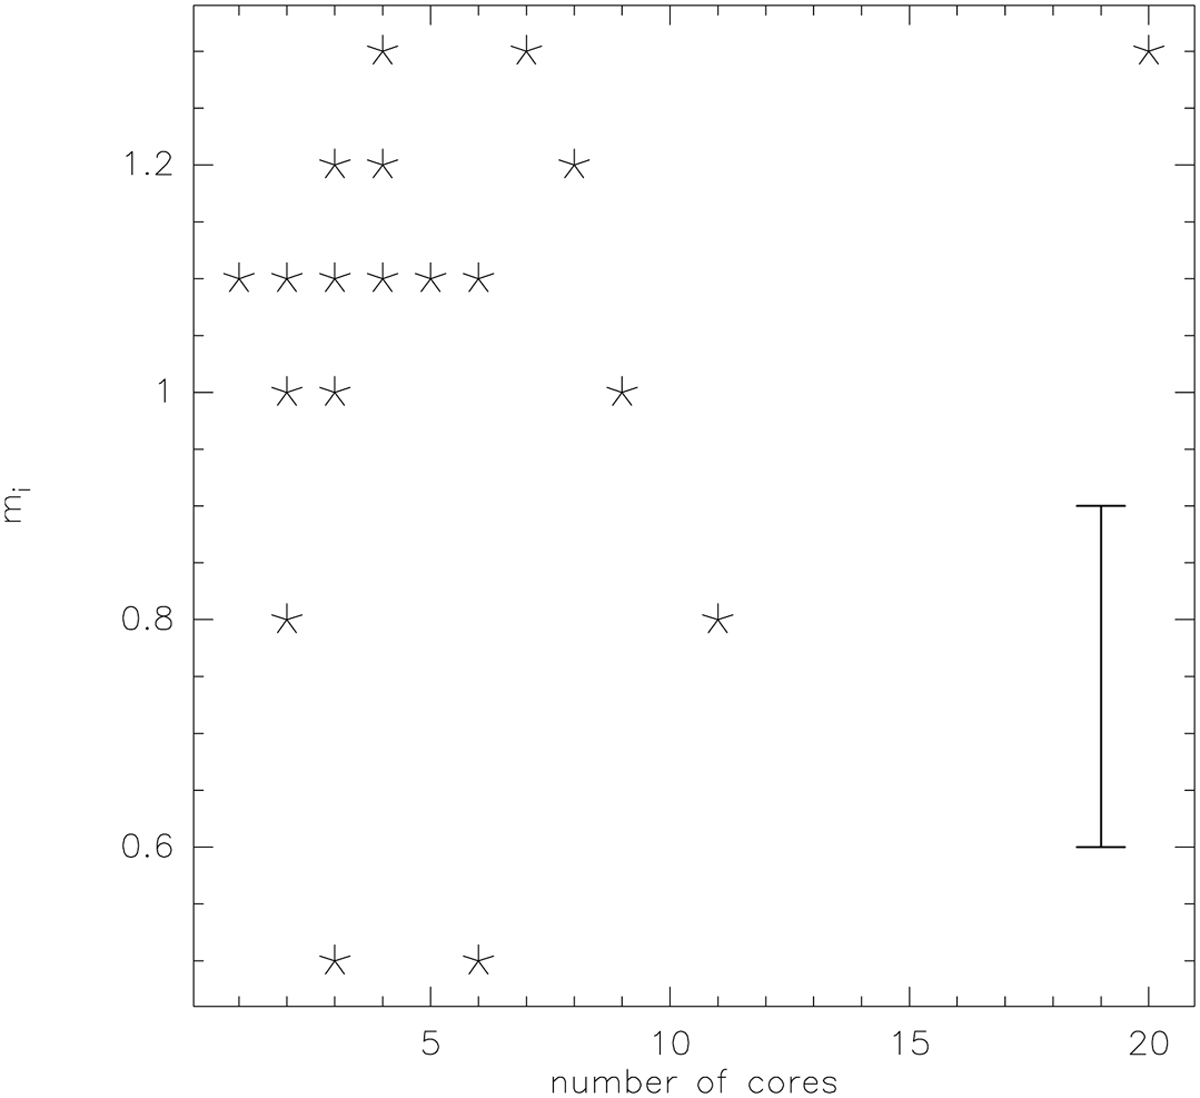
Intensity power-law index mi plotted against the number of cores (Table 1) from Beuther et al. (2018a). The point for 20 cores and a slope of 1.3 consists of two sources. A representative error bar for mi is shown at the bottom right.
Current usage metrics show cumulative count of Article Views (full-text article views including HTML views, PDF and ePub downloads, according to the available data) and Abstracts Views on Vision4Press platform.
Data correspond to usage on the plateform after 2015. The current usage metrics is available 48-96 hours after online publication and is updated daily on week days.
Initial download of the metrics may take a while.