Open Access
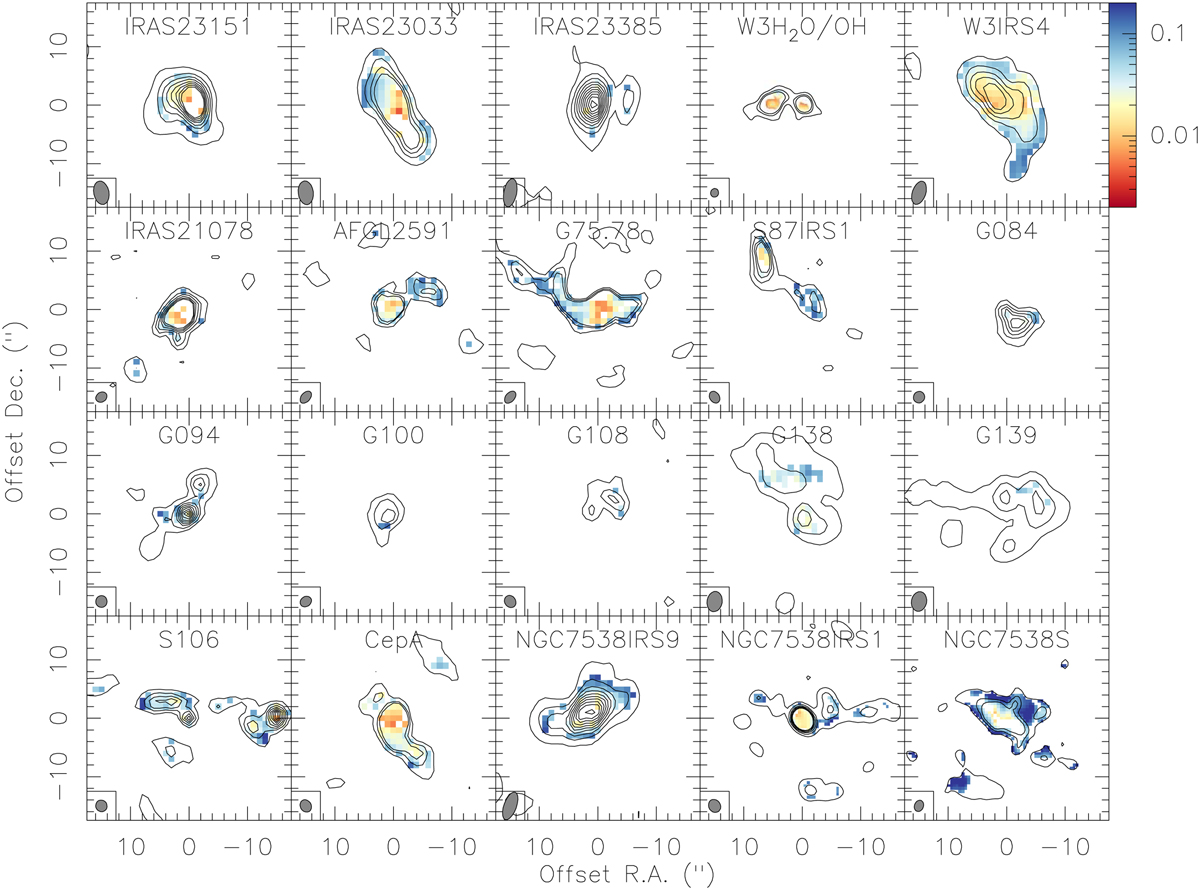
Fig. B.3
Download original image
Polarization fraction maps for all regions are shown in color-scale. The color bar is the same for all and is shown next to the top right panel. The contours show the Stokes I total intensity data starting at the 4σ level and continue in 8σ steps.
Current usage metrics show cumulative count of Article Views (full-text article views including HTML views, PDF and ePub downloads, according to the available data) and Abstracts Views on Vision4Press platform.
Data correspond to usage on the plateform after 2015. The current usage metrics is available 48-96 hours after online publication and is updated daily on week days.
Initial download of the metrics may take a while.