Fig. B.1
Download original image
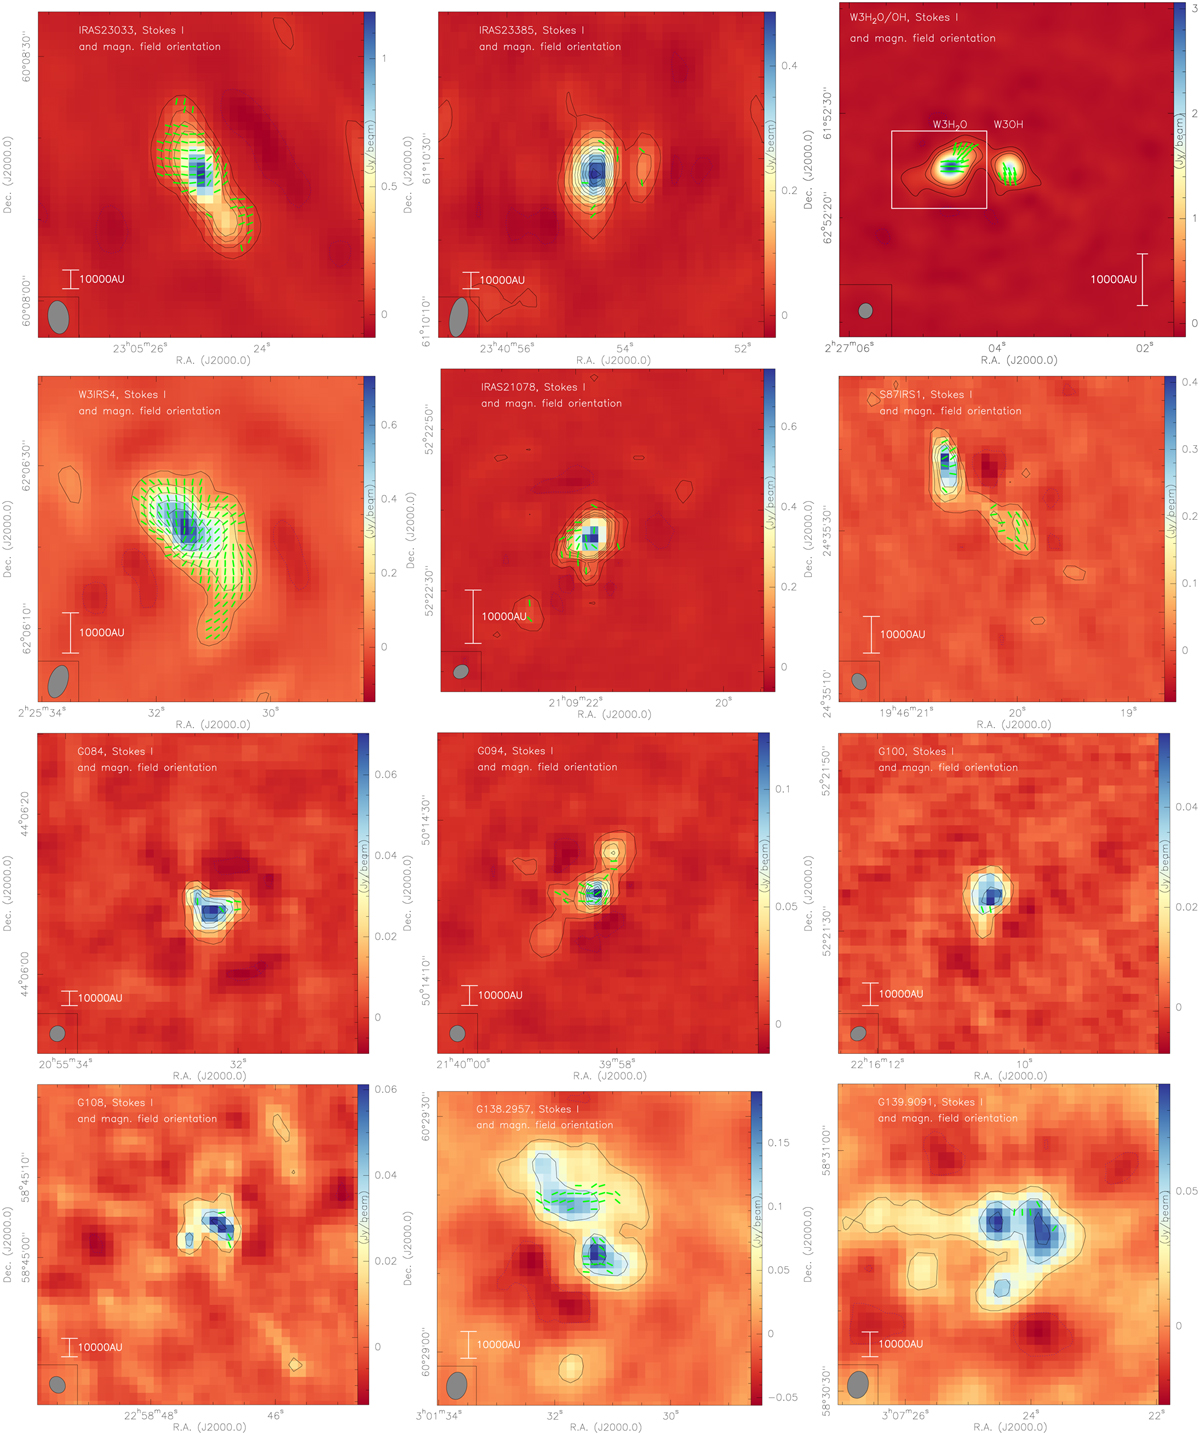
Remaining SMA polarization maps. The color-scale presents the Stokes I total intensity data. The contours show the same data starting at the 4σ level and continue in 8σ steps. The green constant-length line segments present the magnetic field orientation (polarization angles rotated by 90 deg) derived from the linearly polarized continuum data above the 2σ level (independent of the polarization fraction). The synthesized beam and a linear scale bar are shown at the bottom of each panel.
Current usage metrics show cumulative count of Article Views (full-text article views including HTML views, PDF and ePub downloads, according to the available data) and Abstracts Views on Vision4Press platform.
Data correspond to usage on the plateform after 2015. The current usage metrics is available 48-96 hours after online publication and is updated daily on week days.
Initial download of the metrics may take a while.