Open Access
Fig. A.2
Download original image
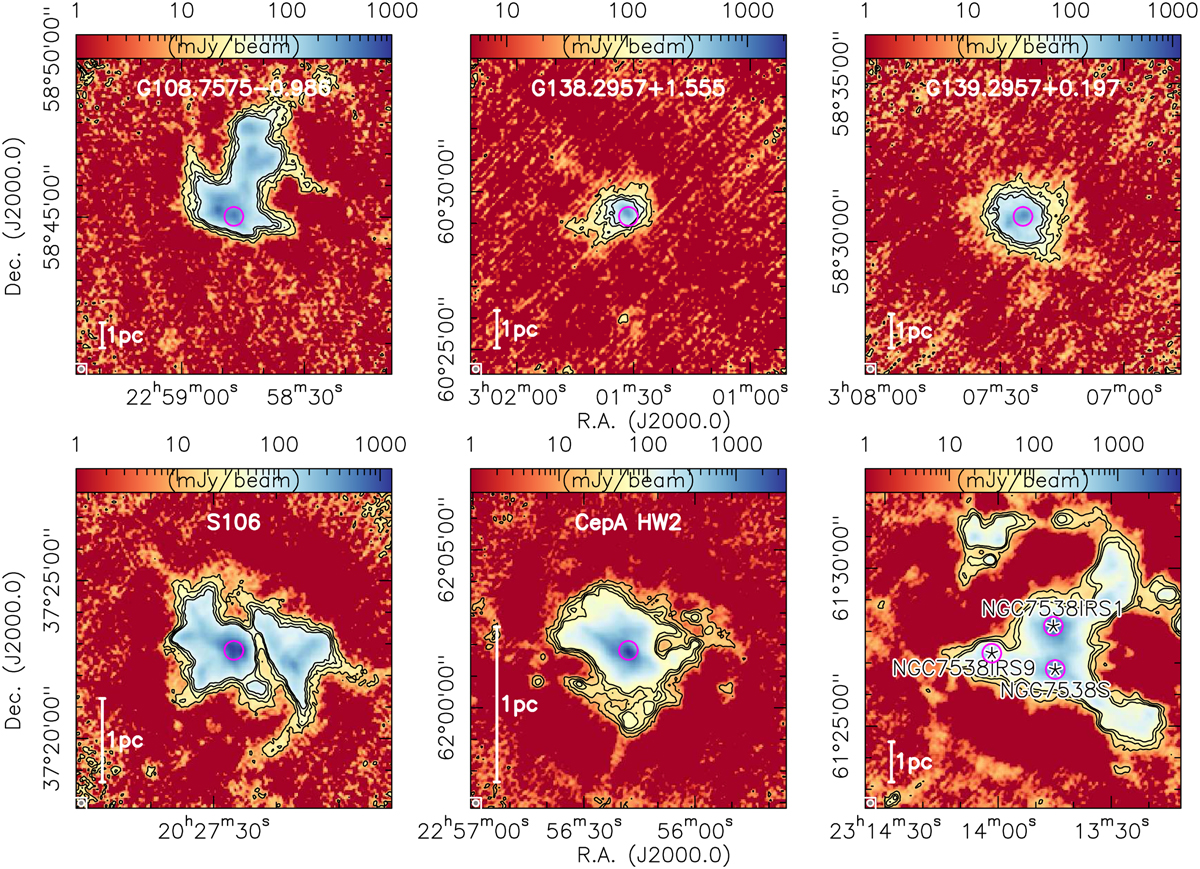
NIKA2 1.2 mm dust continuum images toward the CORE sample. The color-scale shows the flux densities, and the contours are from 3σ to 12σ in 3σ steps. The 12″ beam and a 1 pc scale-bar are shown at the bottom left of each panel. The magenta circles outline the ~ 36″ primary beam size of the corresponding SMA observations.
Current usage metrics show cumulative count of Article Views (full-text article views including HTML views, PDF and ePub downloads, according to the available data) and Abstracts Views on Vision4Press platform.
Data correspond to usage on the plateform after 2015. The current usage metrics is available 48-96 hours after online publication and is updated daily on week days.
Initial download of the metrics may take a while.