Fig. 10
Download original image
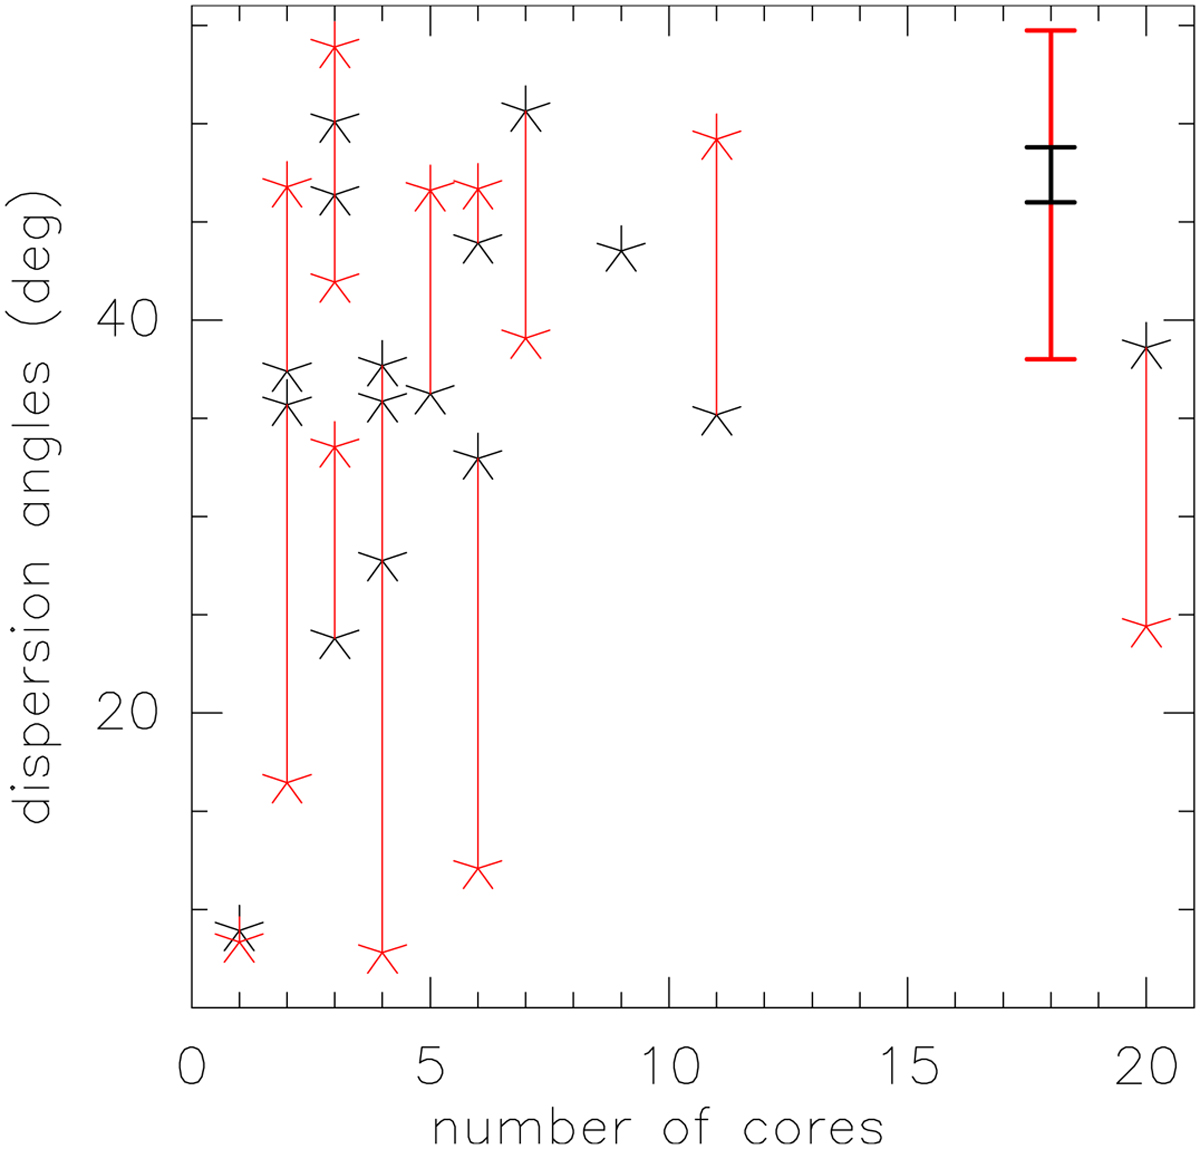
Dispersion angles vs. number of cores. The black stars correspond to the directly measured σψ, whereas the red stars correspond to the b(0) value measured with the structure function analysis. The approximate error bars are shown at the top right in black and red respectively for the σψ and b(0) estimated magnetic field strengths.
Current usage metrics show cumulative count of Article Views (full-text article views including HTML views, PDF and ePub downloads, according to the available data) and Abstracts Views on Vision4Press platform.
Data correspond to usage on the plateform after 2015. The current usage metrics is available 48-96 hours after online publication and is updated daily on week days.
Initial download of the metrics may take a while.