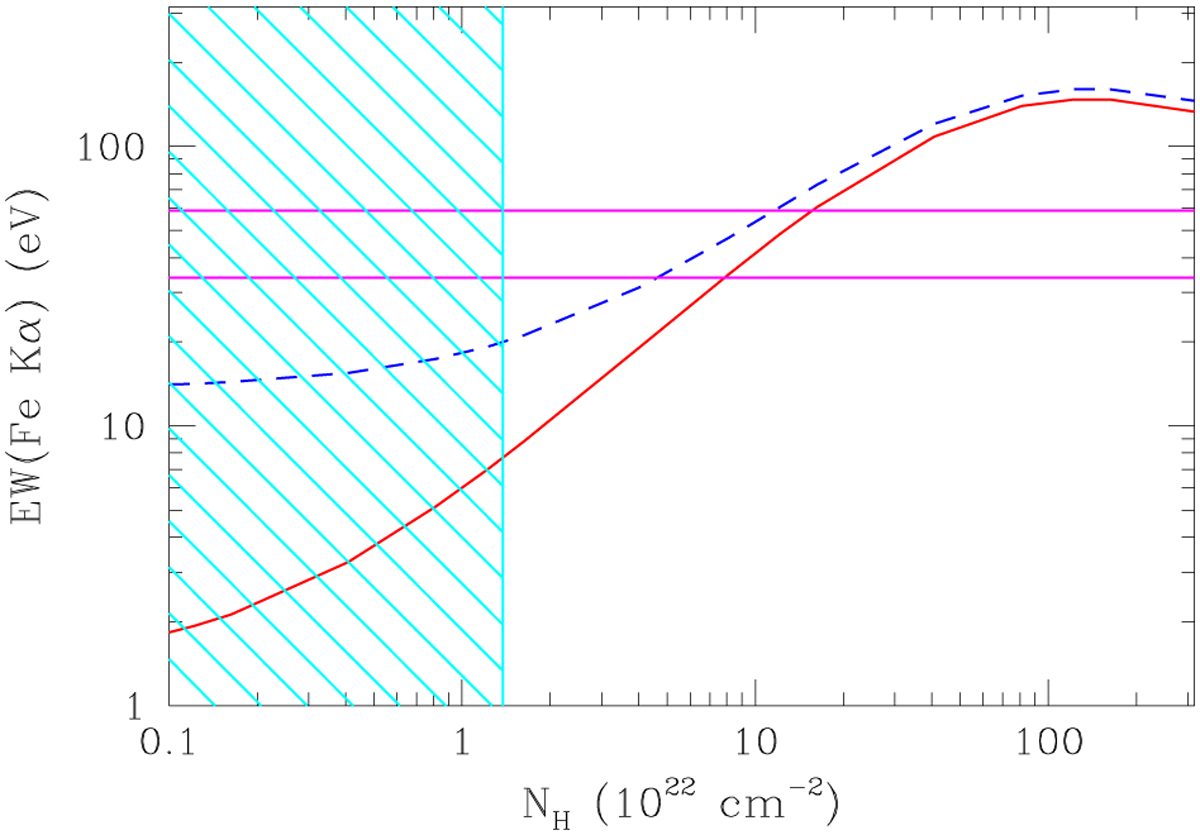
Fig. 7
Download original image
Dependence of the total EW(Fe Kα) from both the cool shell around the propelling NS and the Be disk on the hydrogen column density towards the hot X-ray plasma (evaluated according to Eq. (10)). The red and dashed blue curves illustrate the total EW(Fe Kα) computed respectively for the default model parameters and assuming a Be disk with a Silaj et al. (2010) density profile and extending out to the radius of the Roche lobe. The horizontal magenta lines illustrate the range of the observed EW values. The hatched cyan area illustrates the range of observed hydrogen column densities.
Current usage metrics show cumulative count of Article Views (full-text article views including HTML views, PDF and ePub downloads, according to the available data) and Abstracts Views on Vision4Press platform.
Data correspond to usage on the plateform after 2015. The current usage metrics is available 48-96 hours after online publication and is updated daily on week days.
Initial download of the metrics may take a while.