Fig. 6
Download original image
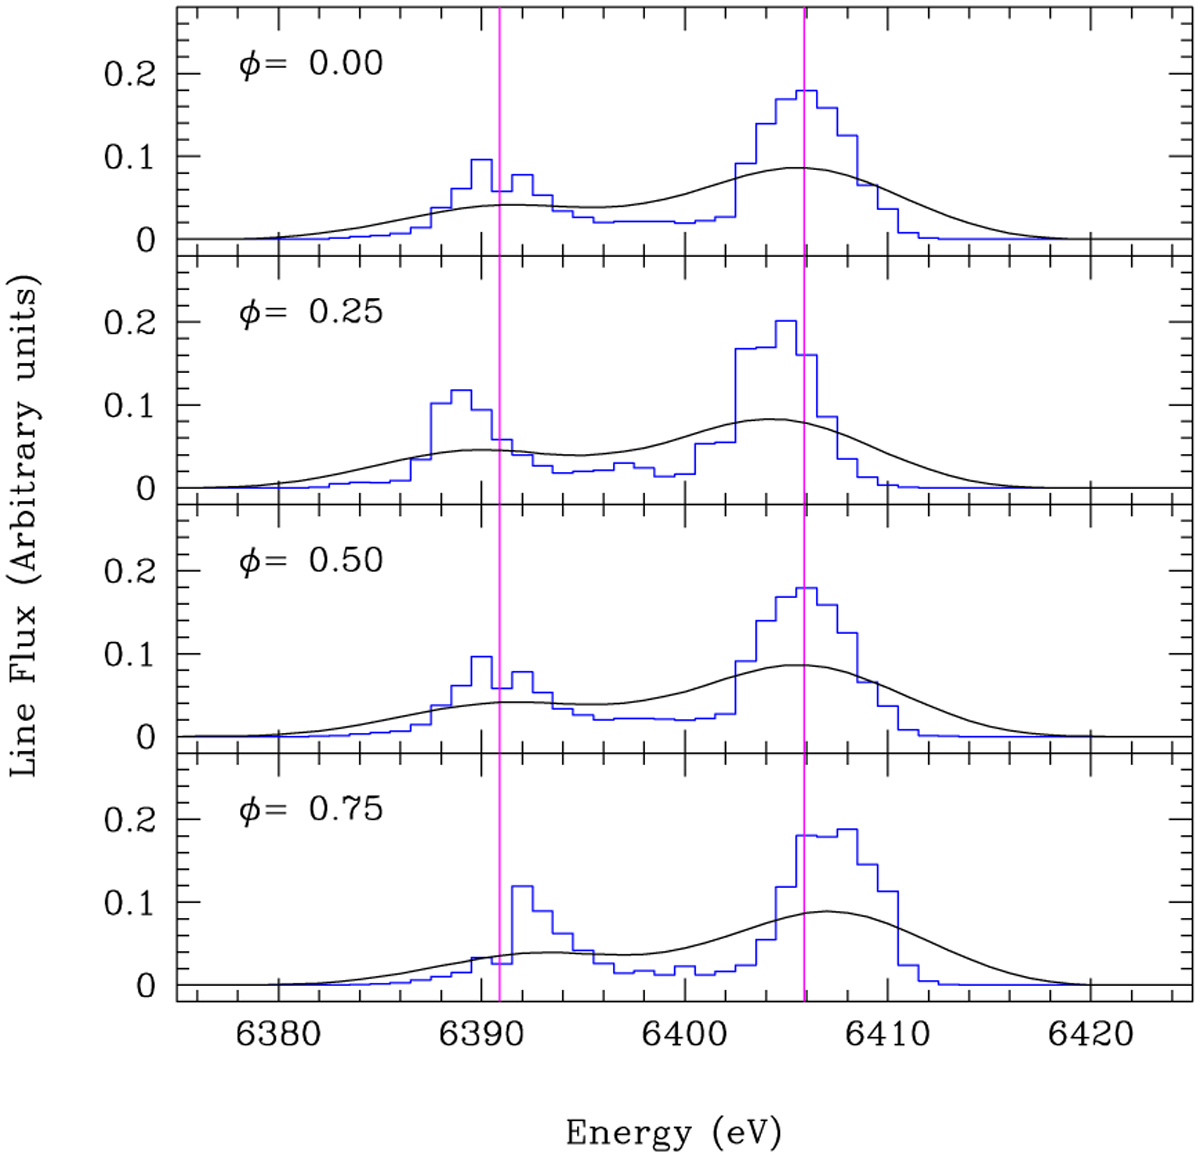
Illustration of the global line profile (i.e. combining the disk and shell contributions and accounting for the full array of transitions), adopting the default parameters of γ Cas at four different orbital phases. The blue histogram shows the spectrum binned in energy bins of 1 eV, whereas the black line provides the result of the convolution with an instrumental response of 6 eV. The magenta lines indicate the position of the centroids of the Kα1 and Kα2 subgroups at phase ϕ = 0.0.
Current usage metrics show cumulative count of Article Views (full-text article views including HTML views, PDF and ePub downloads, according to the available data) and Abstracts Views on Vision4Press platform.
Data correspond to usage on the plateform after 2015. The current usage metrics is available 48-96 hours after online publication and is updated daily on week days.
Initial download of the metrics may take a while.