Fig. 6
Download original image
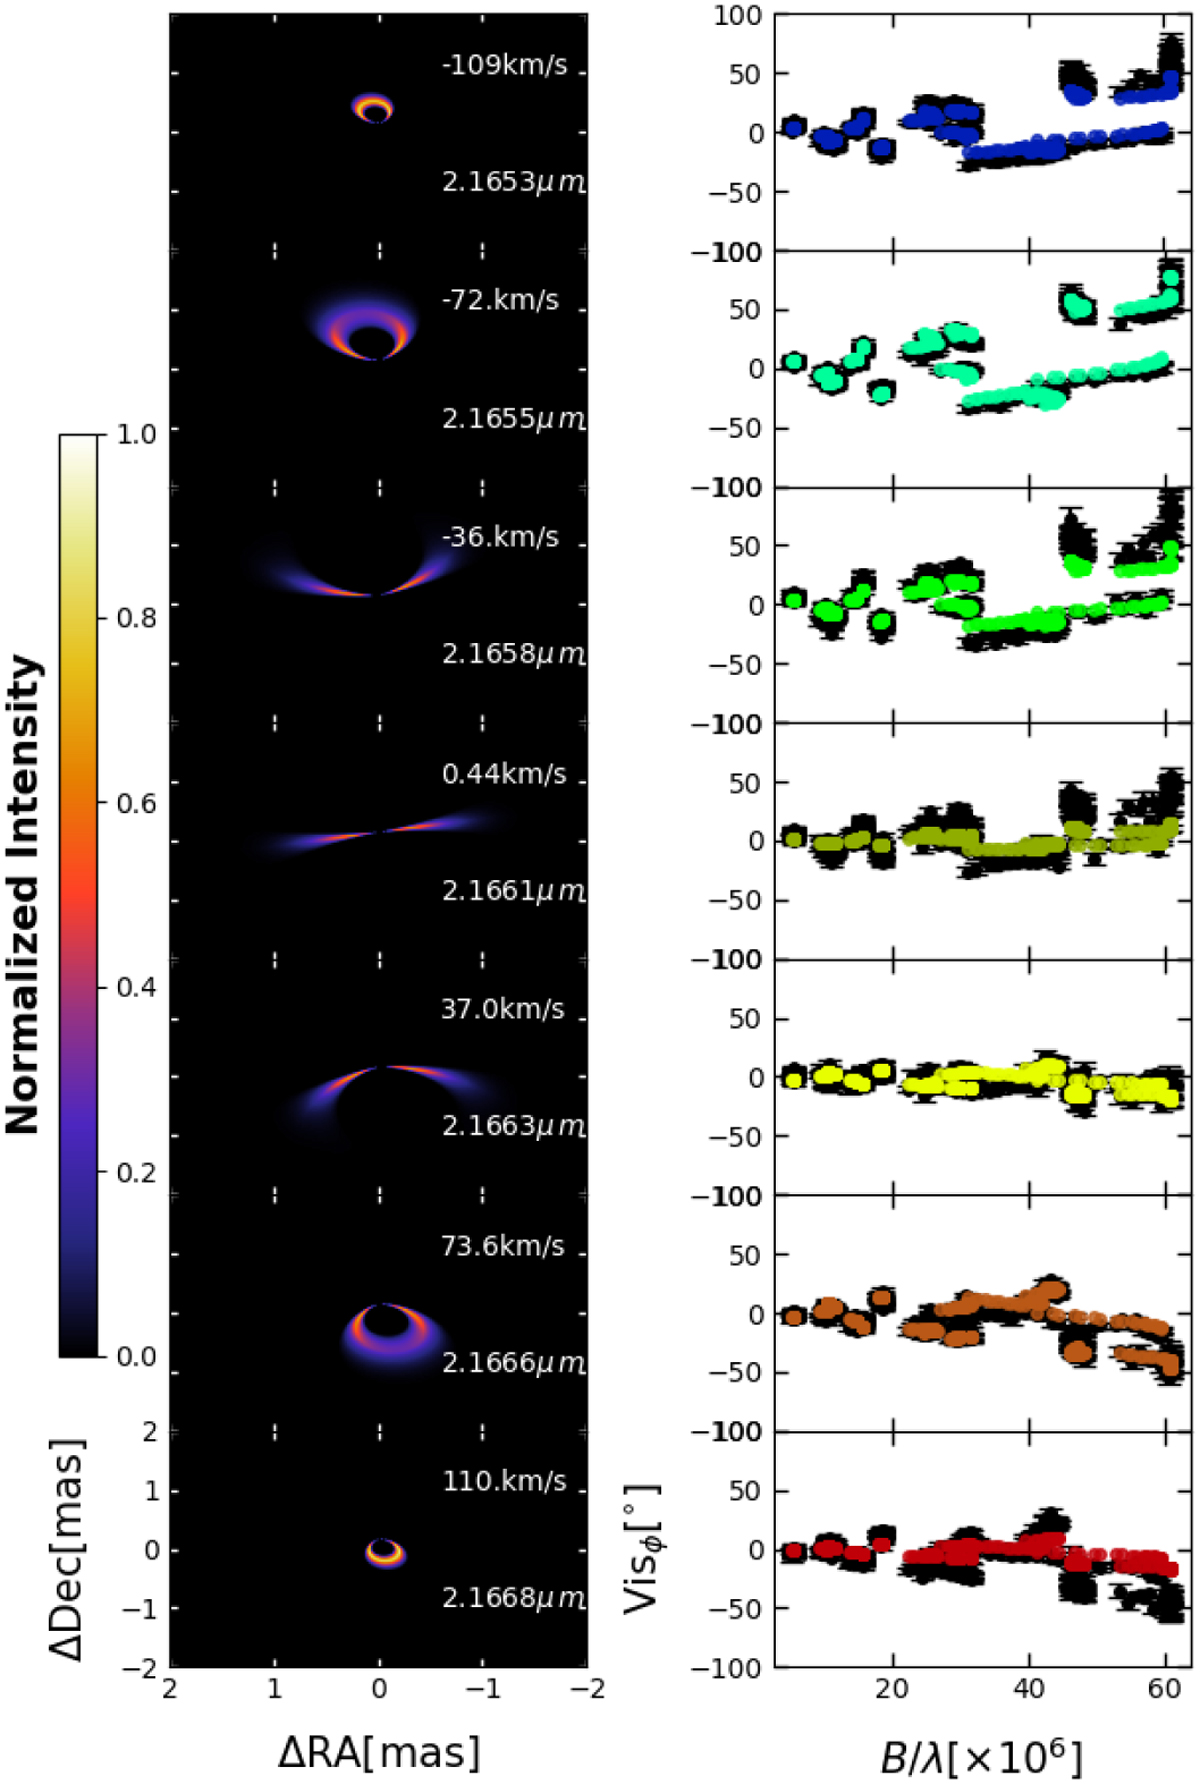
Results of the Keplerian disk model fitting. Left: velocity maps from our Brγ line Keplerian disk model. From top to bottom, we show velocity maps at: ~ −110 km s−1, ~ −73 km s−1, ~ −36km s−1, ~0 km s−1, ~37 km s−1, ~74 km s−1, and ~110 km s−1. See the main text for details. Right: comparison between the observed continuum-corrected Brγ line absolute phases (black dots) and those obtained from the Brγ line Keplerian disk model shown in left panel (coloured dots).
Current usage metrics show cumulative count of Article Views (full-text article views including HTML views, PDF and ePub downloads, according to the available data) and Abstracts Views on Vision4Press platform.
Data correspond to usage on the plateform after 2015. The current usage metrics is available 48-96 hours after online publication and is updated daily on week days.
Initial download of the metrics may take a while.