Open Access
Fig. 5
Download original image
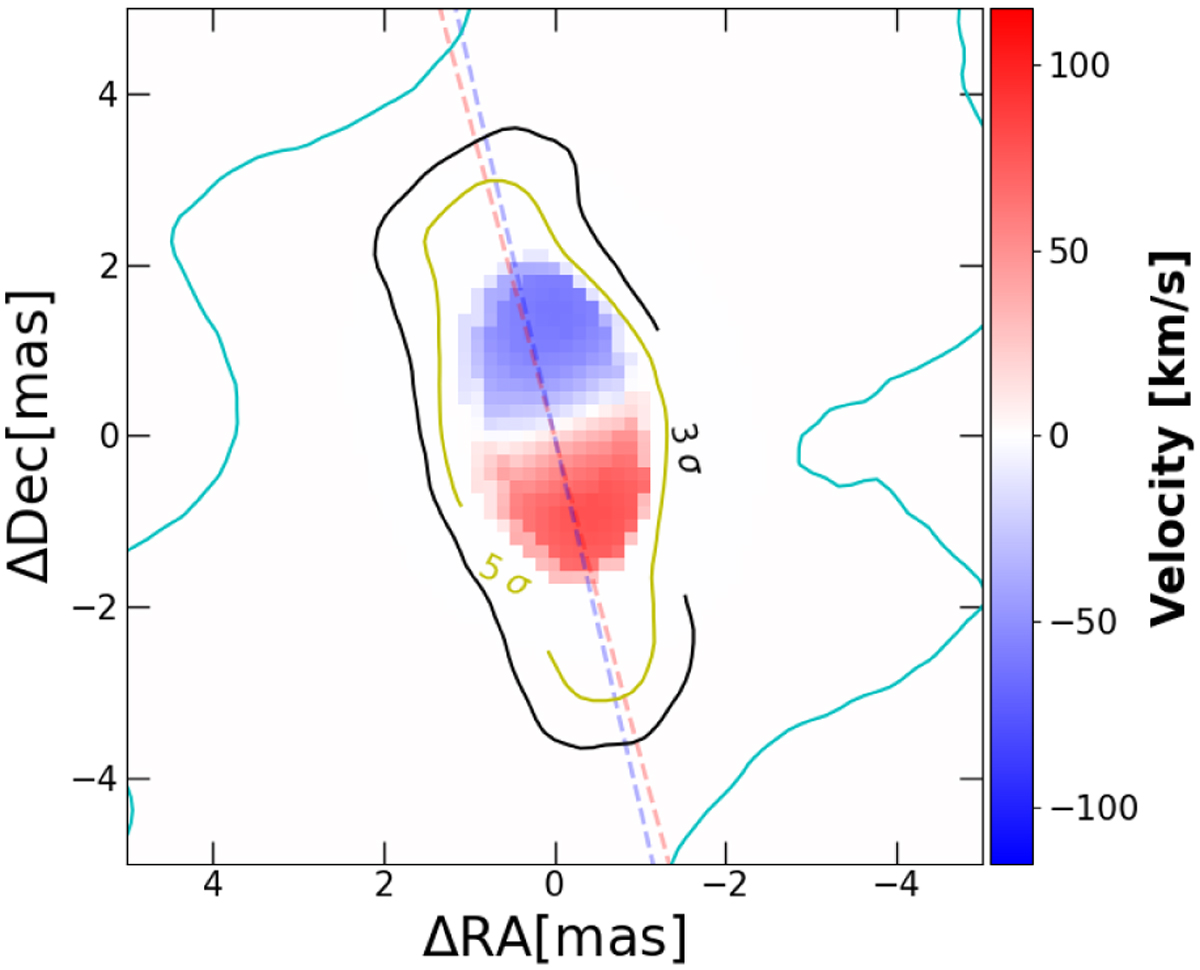
Brγ line first moment map (M1) obtained from the line velocity-dispersed images. For comparison, the 1, 3, and 5σ K-band continuum contours are overplotted in cyan, black, and yellow. The dashed red and blue lines illustrate the orientation of the semi-major axis of the continuum and the Brγline emission, respectively.
Current usage metrics show cumulative count of Article Views (full-text article views including HTML views, PDF and ePub downloads, according to the available data) and Abstracts Views on Vision4Press platform.
Data correspond to usage on the plateform after 2015. The current usage metrics is available 48-96 hours after online publication and is updated daily on week days.
Initial download of the metrics may take a while.