Fig. 4
Download original image
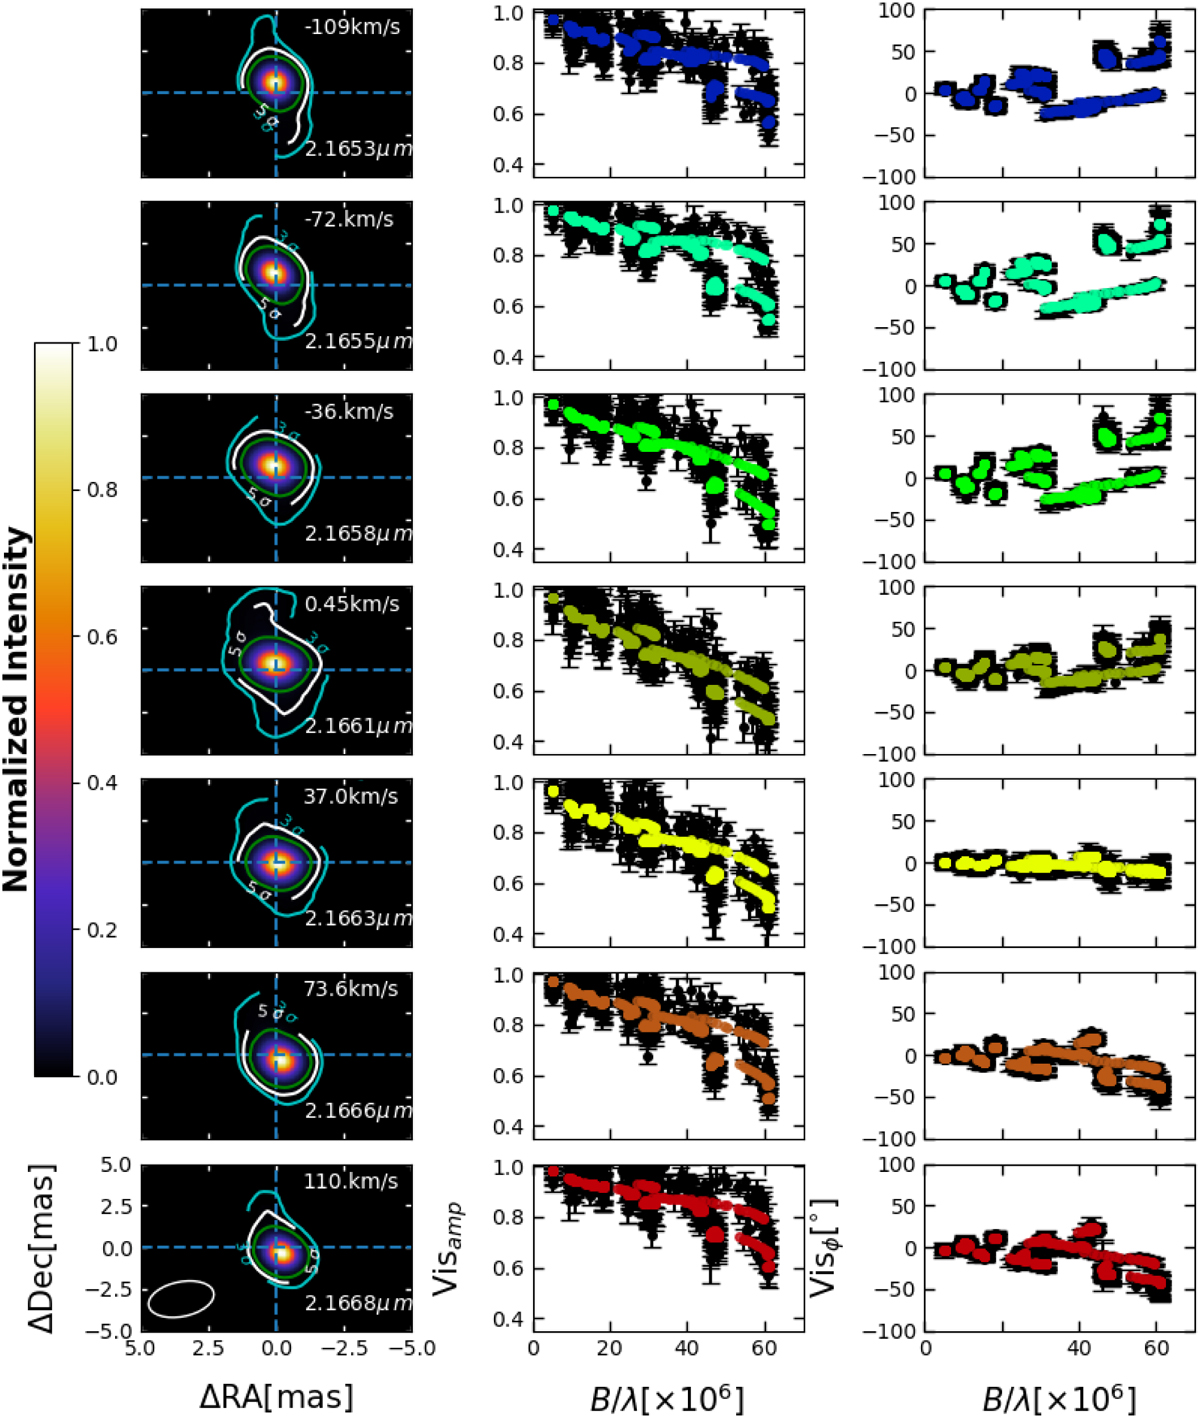
Results of the image reconstruction. Left: H I Brγ line reconstructed images of HD58647. North is up, and east is to the left. Contours represent 3, 5, and 10σ. Middle and right: comparison of the observed continuum-subtracted visibility amplitudes and absolute phases (black circles with error bars) with the synthetic observables extracted from the reconstructed image.
Current usage metrics show cumulative count of Article Views (full-text article views including HTML views, PDF and ePub downloads, according to the available data) and Abstracts Views on Vision4Press platform.
Data correspond to usage on the plateform after 2015. The current usage metrics is available 48-96 hours after online publication and is updated daily on week days.
Initial download of the metrics may take a while.