Fig. 3
Download original image
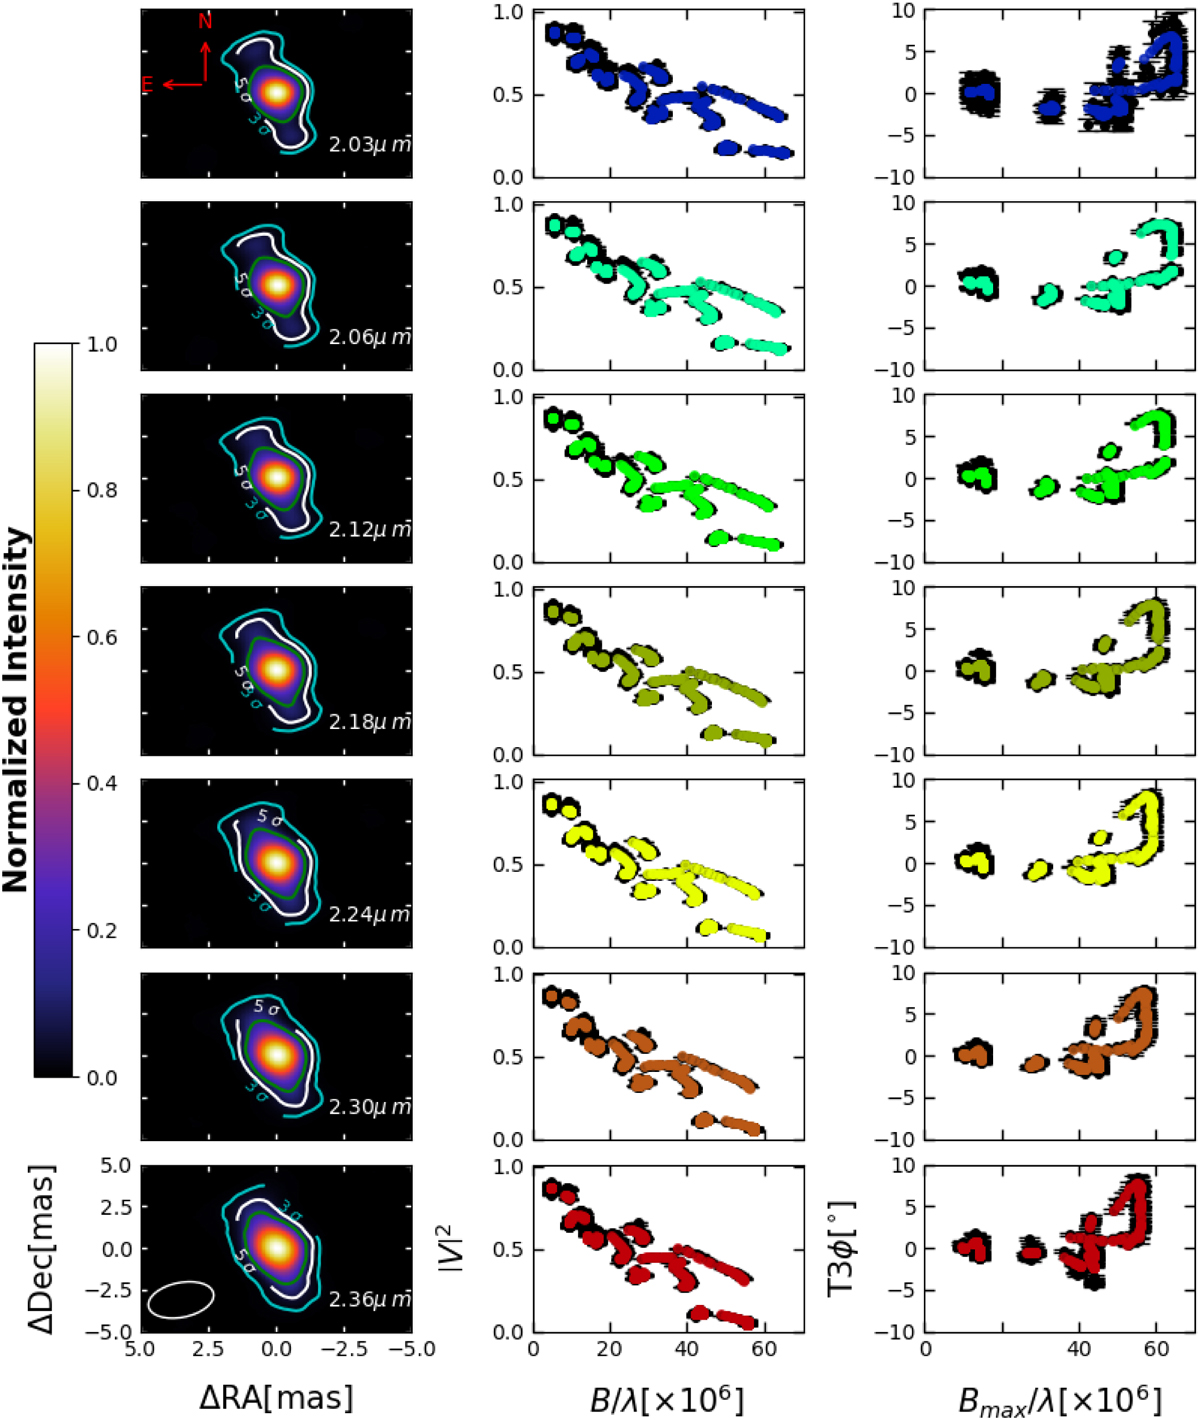
Results of the image reconstruction. Left: K-band continuum reconstructed images of HD 58647 at different wavelengths (reported in the labels). North is up, and east is to the left. The white hollow ellipse at the lower-left corner of the bottom panel represents the size of the clean beam. Contours represent 3, 5, and 10 σ pixel significance levels. Middle and right: squared visibilities (|V|2; middle panel) and closure phases (T3ϕ; right panel) as a function of the spatial frequency. The observed data with their corresponding error bars are represented as black dots, while the synthetic observables extracted from the reconstructed images are shown in colour.
Current usage metrics show cumulative count of Article Views (full-text article views including HTML views, PDF and ePub downloads, according to the available data) and Abstracts Views on Vision4Press platform.
Data correspond to usage on the plateform after 2015. The current usage metrics is available 48-96 hours after online publication and is updated daily on week days.
Initial download of the metrics may take a while.