Open Access
Fig. D.2
Download original image
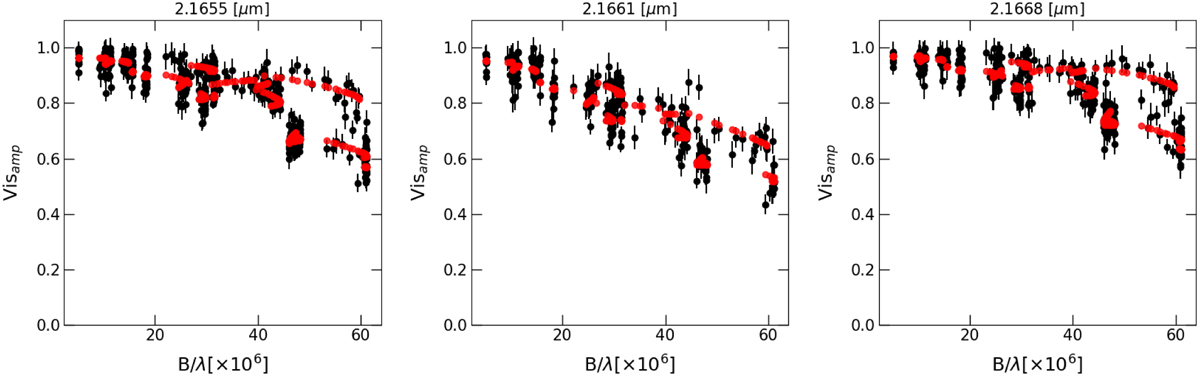
Brγ line model-fitting results (red dots) as a function of the spatial frequency at three different spectral channels. For comparison, the continuum-corrected Brγ line visibilities are overplotted in black.
Current usage metrics show cumulative count of Article Views (full-text article views including HTML views, PDF and ePub downloads, according to the available data) and Abstracts Views on Vision4Press platform.
Data correspond to usage on the plateform after 2015. The current usage metrics is available 48-96 hours after online publication and is updated daily on week days.
Initial download of the metrics may take a while.