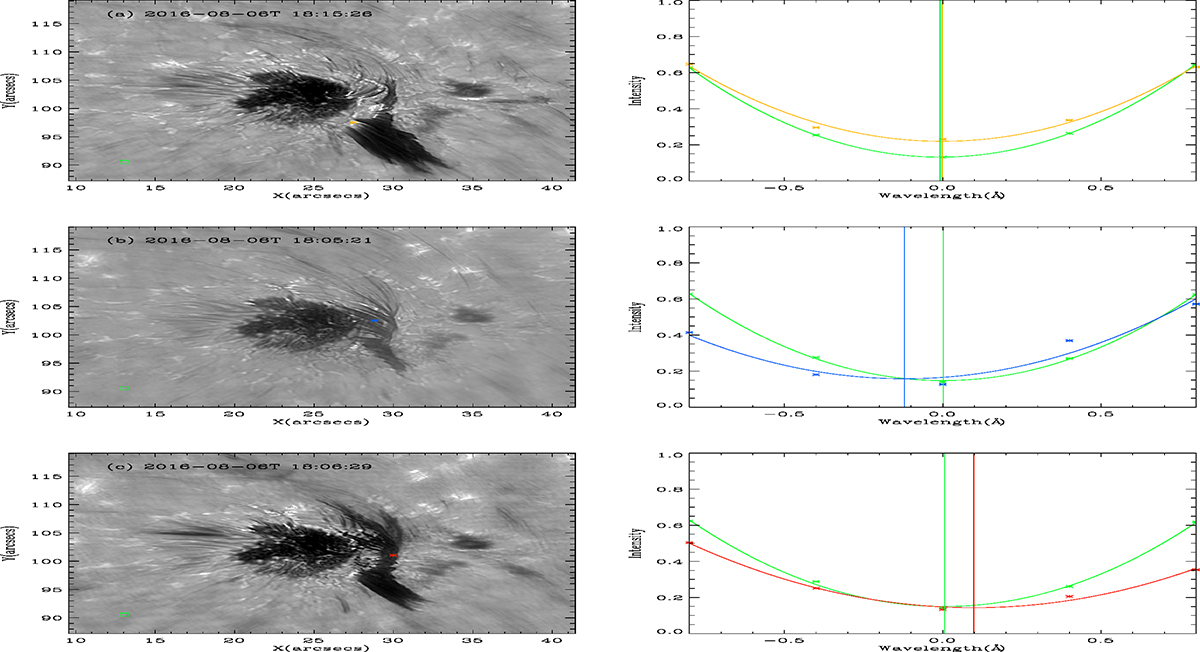
Fig. 7.
Download original image
Examples of normalized Hα spectral profiles in the jet and its footpoint (right panels). The top right panel corresponds to the profiles of the jet footpoint at 18:15:26 UT. The normalized Hα spectral profile (yellow line) at the footpoint of the jet and reference profile (green line) are shown in the right panel. The footpoint (yellow dot) and the quiet region (green box) are marked in the image of the Hα +0.8 Å in panel a. In panels b and c, the upflow (blue dot) and downflow (red dot) of intermittent jets are marked in the images of Hα +0.8 Å at 18:05 UT and at 18:06 UT, respectively. The normalized Hα spectral profile of the upflow (blue line), downflow (red line), and the reference profile (green line) are shown in the corresponding right panels.
Current usage metrics show cumulative count of Article Views (full-text article views including HTML views, PDF and ePub downloads, according to the available data) and Abstracts Views on Vision4Press platform.
Data correspond to usage on the plateform after 2015. The current usage metrics is available 48-96 hours after online publication and is updated daily on week days.
Initial download of the metrics may take a while.